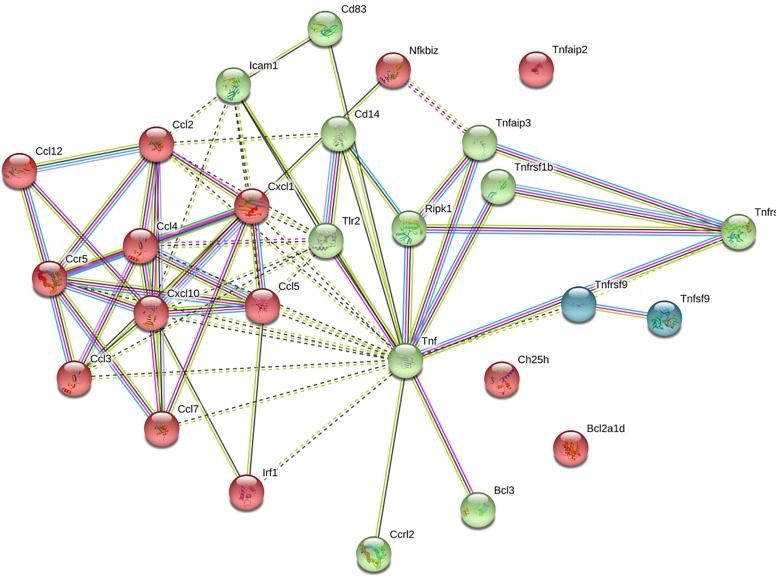
FIGURE 8.
Protein–protein interaction networks of differentially expressed genes upon hyaluronidase treatment. Using STRING database 25 genes were used to construct the PPI network. PPI, protein–protein interactions. Colors of nodes indicate result of clustering. Nodes represent proteins, edges represent protein–protein associations. Dotted lines indicate insignificant link, solid lines indicate significant interactio, pink lines indicate experimentally determined interaction, blue lines from curated database, black lines indicate co-expression, yellow lines indicate text mining, and gray lines indicate protein homology.

