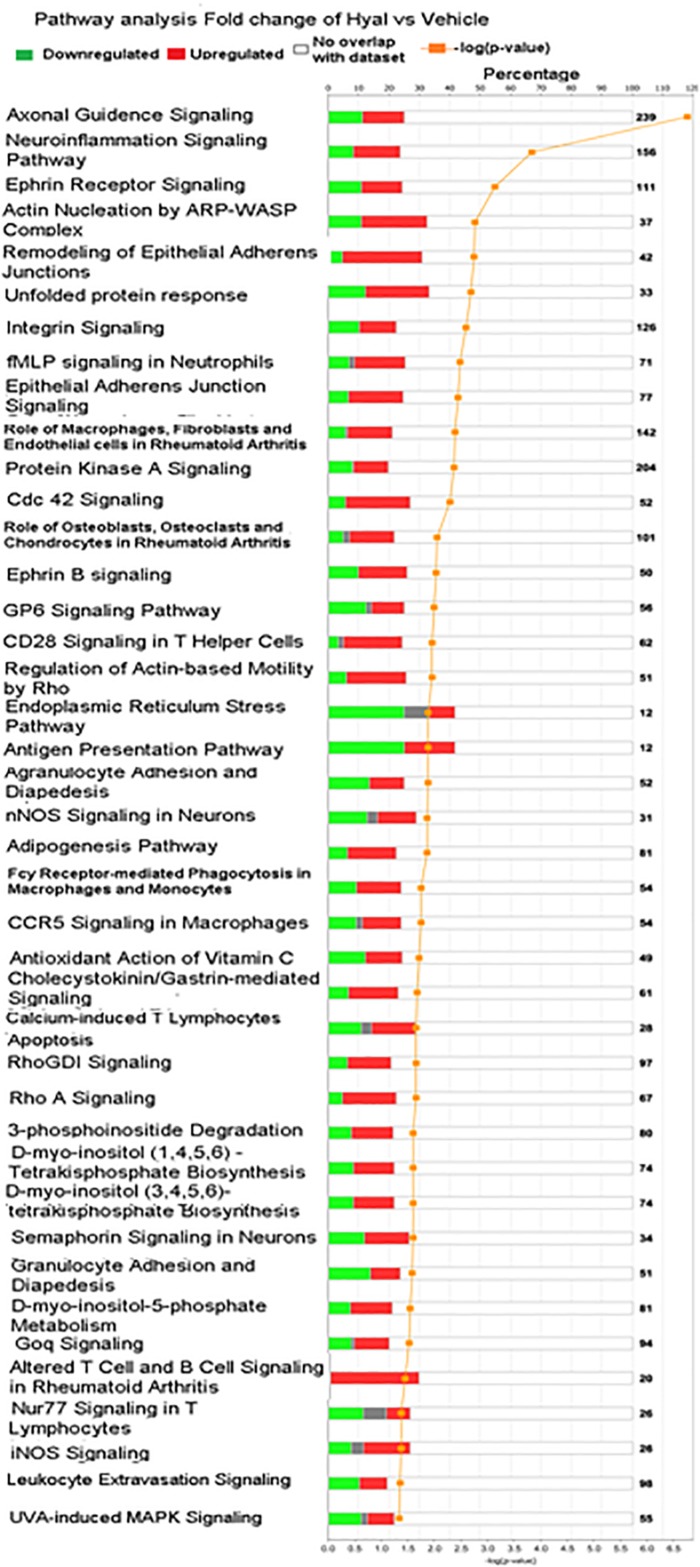
FIGURE 9.
Significantly enriched pathways of significant genes in response to hyaluronan digestion. Green bars represent number of downregulated genes, red bars represent number of upregulated genes, gray bars represent no change of expression, orange curve with dots represent (–log10 (P value) – FDR), numbers in right border reflect number of genes including in canonical pathway.

