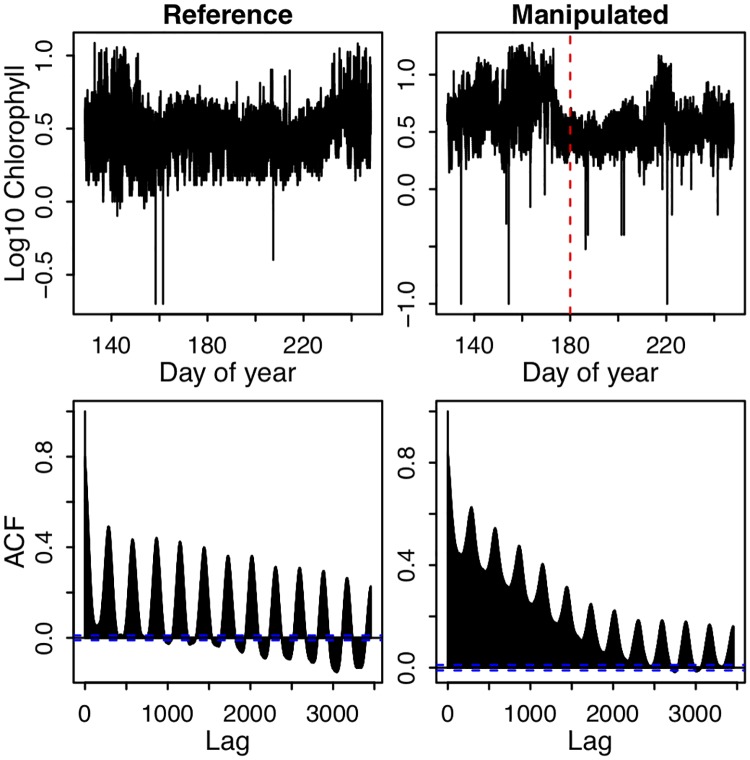
Fig 4. Time series and autocorrelation function of high frequency in situ chlorophyll fluorescence measurements in Peter Lake (manipulated) and Paul Lake (reference) in 2015.
The red vertical dashed line indicates the day when fertilization was halted in Peter Lake. For the bottom panels, vertical bars are drawn from 0 to a height corresponding to the correlation, and the horizontal axis is the time lag of the correlation measured in time steps for the entire period of study. The horizontal blue dashed lines surround the (relatively narrow) region above or below which the values of autocorrelation are significant at α = 0.05. The time series resolution is five minutes, such that the correlation at a lag of 288 represents the autocorrelation at a daily time scale.

