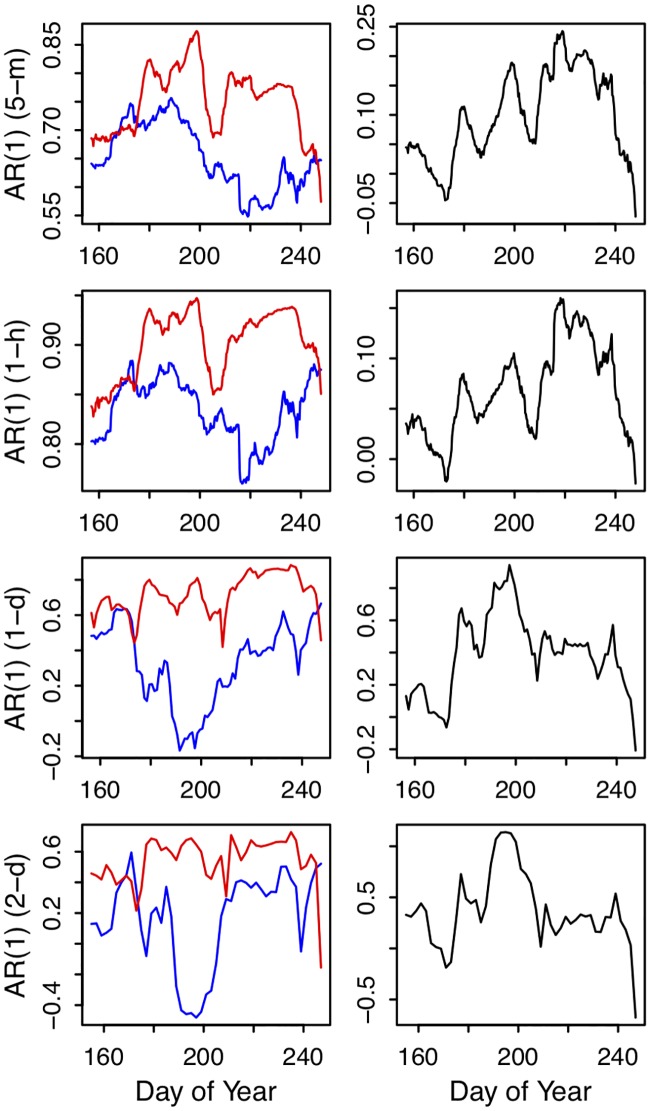
Fig 5. Rolling windows of first-order autocorrelation from detrended chlorophyll time series.
Blue lines are from Paul Lake (reference), red lines are Peter Lake (manipulated). In the second column, the black lines represent the difference (Peter—Paul) between the lines in the first column (positive values indicate that autocorrelation was higher in Peter than in Paul). Time series in each row were aggregated to a different time scale prior to analysis (indicated in the y-axis label: 5-minute, 1-hour, 1-day, 2-day).

