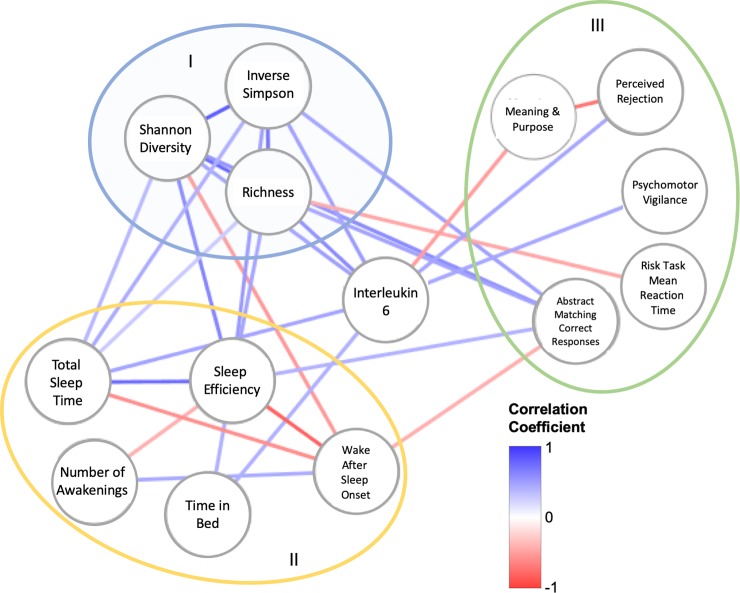
Fig 1. The interaction network between measures of sleep, microbiome diversity and cognitive performance.
Pearson correlation coefficients were used to generate the weight of each edge in the network. Heat map shown on image. Different colored circles indicate groupings of nodes with similar traits in the network (I = microbiome diversity, II = sleep, III = cognition). Raw data for correlations (outside of microbiome diversity control correlations) found in S1–S4 Figs. Directionality of interactions is not implied in this figure.

