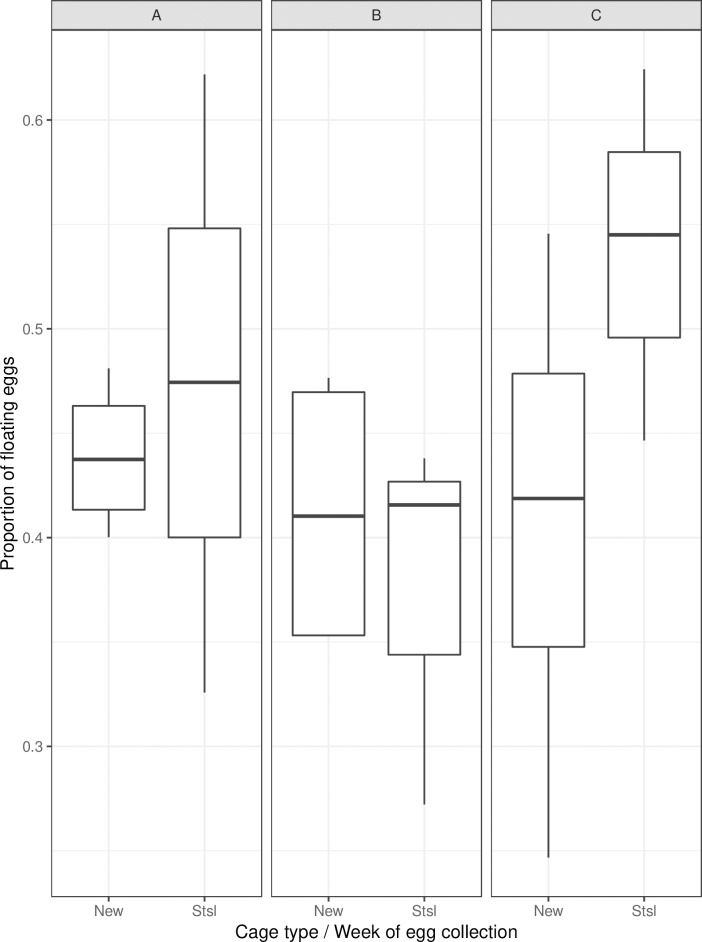
Fig 4. Proportion of floating eggs according to the cage type and week of egg collection.
Panels A, B and C indicate weeks 1, 2 and 3 of egg collection respectively. New (n = 12) and Stsl (n = 9) represent cage types, namely the mass-rearing cage prototype and the FAO/IAEA stainless-steel cage, and n denotes the number of analyzed samples. The bars represent the median, upper and lower quartiles.

