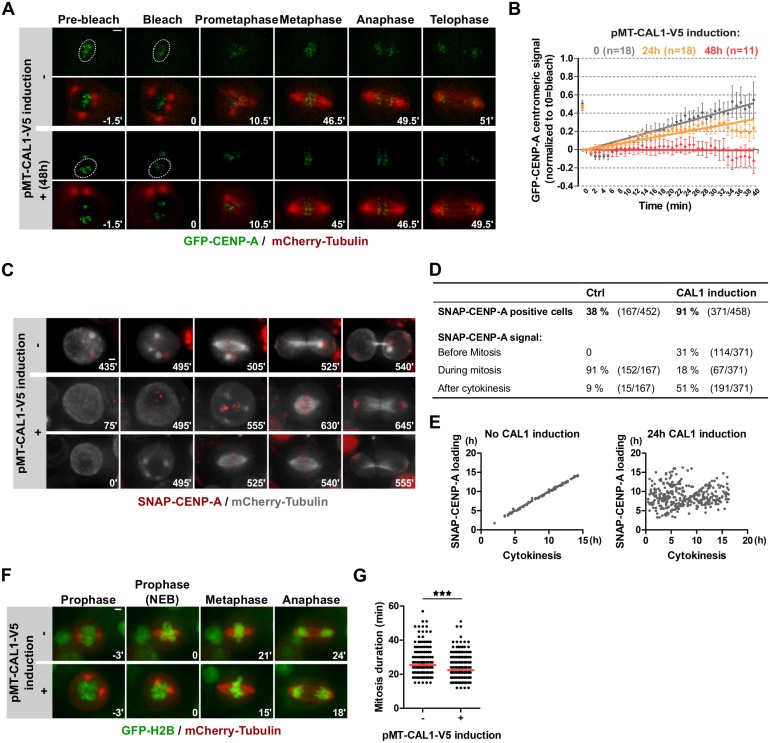
Fig 2. Overexpression of CAL1 leads to CENP-A centromeric loading outside of mitosis.
A. FRAP experiments of GFP-CENP-A in pMT-CAL1-V5-overexpressing cells during mitosis. After 48 h pMT-CAL1-V5 induction, GFP-CENP-A signal was partially bleached in prophase and cells imaged until telophase. Time-lapse: 90 s. Scale bar: 2 μm. B. Quantification of A. The total GFP-CENP-A centromeric signal is shown as mean +/- SEM, n ≥ 11 cells. C. Time-lapse imaging of SNAP-CENP-A/mCherry-Tubulin cells with or without prior induction of pMT-CAL1-V5 (24 h). Cells were treated with SNAP-Block to quench existing SNAP-CENP-A molecules and washed before adding 0.5 μM SNAP-640 dye to visualize newly synthesized SNAP-CENP-A. Imaging: 16 h. Time-lapse: 15 min. Scale bar: 2 μm. Intensity levels have been adjusted separately for each condition. D-E. Quantifications of C. D. Percentage of SNAP-CENP-A positive cells and their timing of loading. E. For each cycling cell, the earliest detection time point of SNAP-CENP-A (Y-axis) is plotted versus the time of cytokinesis (X-axis). t0 on both axes corresponds to the start of imaging after SNAP-Block. F. Time-lapse imaging of H2B-GFP/mCherry-Tubulin cells with or without prior induction of pMT-CAL1-V5 (24 h). Imaging: 16 h. Time-lapse: 3 min. Scale bar: 2 μm. G. Quantification of F showing the mitosis duration from nuclear envelope breakdown (determined by mCherry-Tubulin nuclear diffusion concomitant to DNA condensation) to anaphase entry. Mean +/- SEM, n>200 cells. Student’s t-test (*: p<0.05; **: p<0.01, ***: p<0.001).

