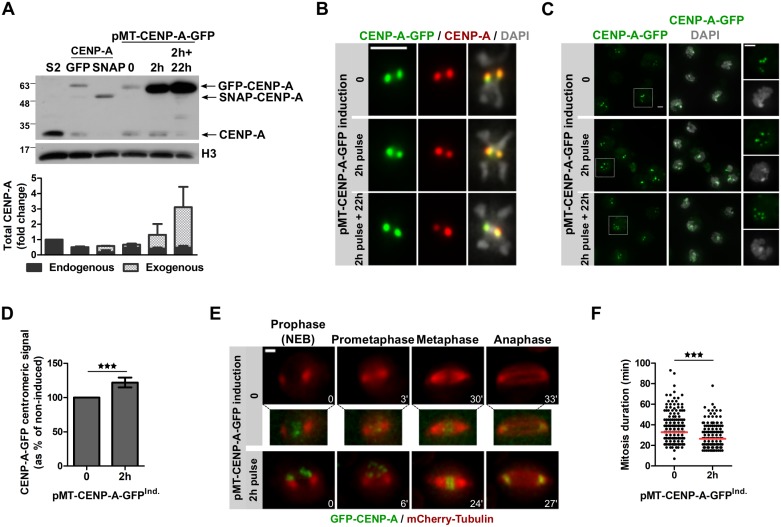
Fig 3. CENP-A overexpression is associated with shorter mitosis duration.
A. Immunoblot showing CENP-A levels in different cell lines. CENP-A antibodies detect endogenous and tagged CENP-A. GFP-CENP-A and SNAP-CENP-A are under the constitutive Copia promoter; CENP-A-GFP was induced with 10 μM CuSO4 for 2 h. H3 serves as a loading control. The graph shows the fold change of CENP-A compared to S2 cells (N = 4). B. Metaphase chromosomes of pMT-CENP-A-GFP cells induced with 10 μM CuSO4 for 2 h stained with anti-CENP-A antibody. DNA (DAPI) is shown in grey. Intensities have been adjusted for each condition. Scale bar: 2 μm. C. Immunofluorescence of pMT-CENP-A-GFP cells as in B. DNA (DAPI) is shown in grey. Scale bar: 2 μm. D. Quantification of C showing the total CENP-A-GFP centromeric intensity per nucleus as % of non-induced pMT-CENP-A-GFP. Mean +/- SEM of 3 experiments (n>300 cells), Student’s t-test (***: p<0.001). E. Time-lapse imaging of cells expressing mCherry-tubulin and pMT-CENP-A-GFP induced as in B, washed, and imaged for 16 h. Time-lapse: 3 min. Scale bar: 2 μm. The intensity of CENP-A-GFP in control cells is enhanced for visualization purposes. F. Quantification of mitosis duration shown in E. Mean +/- SEM, n>300 cells. Student’s t-test (***: p<0.001).

