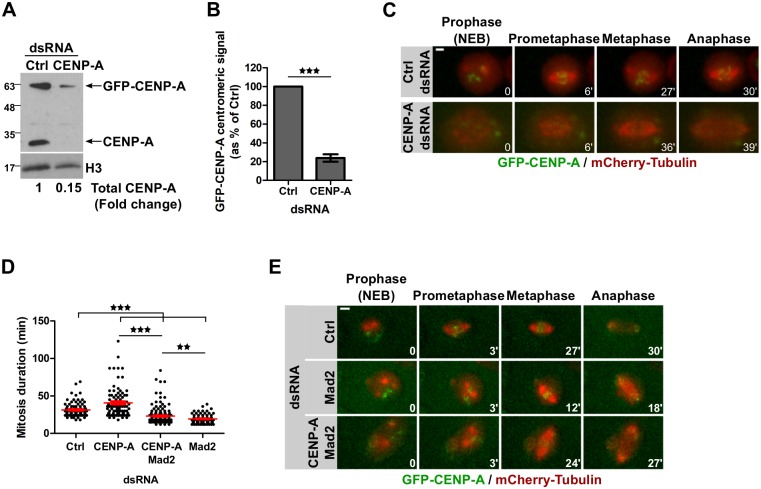
Fig 4. Reduced CENP-A at centromeres leads to longer mitosis through SAC activity.
A. Immunoblot showing CENP-A knockdown efficiency (72 h) in GFP-CENP-A/mCherry-Tubulin expressing cells using anti-CENP-A antibodies to detect endogenous CENP-A and overexpressed GFP-CENP-A. B. Quantification showing GFP-CENP-A centromeric signal intensity per nucleus at t0 of time-lapse imaging as in C. Mean +/- SEM, n>80 cells. Student’s t-test (***: p<0.001). C. Time-lapse imaging of GFP-CENP-A/mCherry-tubulin expressing cells after 72 h CENP-A depletion. Imaging: 16 h. Time-lapse: 3 min. Scale bar: 2 μm. D. Quantification of C and E showing the mitosis duration of control, CENP-A, Mad2 or CENP-A/Mad2-depleted cells. Mean +/- SEM, n>80 cells. Student’s t-test (***: p<0.001). E. Time-lapse imaging of GFP-CENP-A/mCherry-tubulin expressing cells after 72 h Mad2 or CENP-A/Mad2 depletion. Imaging: 16 h. Time-lapse: 3 min. Scale bar: 2 μm.

