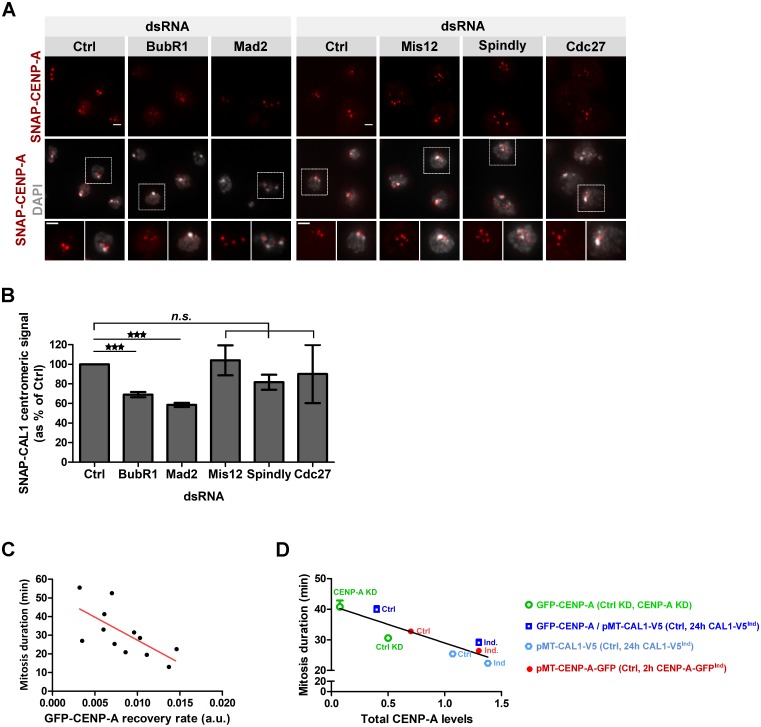
Fig 5. CENP-A loading is correlated with mitosis duration.
A. SNAP-CENP-A incorporation in BubR1, Mad2, Mis12, Spindly or Cdc27-depleted cells. After 72 h dsRNA treatment, a Quench-Chase-Pulse experiment (scheme in Fig 1H) was performed to stain newly synthesized SNAP-CENP-A molecules (red). DNA (DAPI) is shown in grey. Scale bar: 2 μm. B. Quantification of A. The total SNAP-CENP-A centromeric signal intensity per nucleus is shown as % of control cells. Mean +/- SEM of 3 experiments (n>300 cells), Student’s t-test (n.s.: non-significant; ***: p<0.001). C. The recovery rate of GFP-CENP-A after photobleaching in mitosis plotted against the mitosis duration for each cell. Pearson’s correlation test, p<0.01. D. Total CENP-A protein levels (determined by immunoblotting) are plotted against the mitosis duration for each cell line. Pearson’s correlation test, p<0.01.

