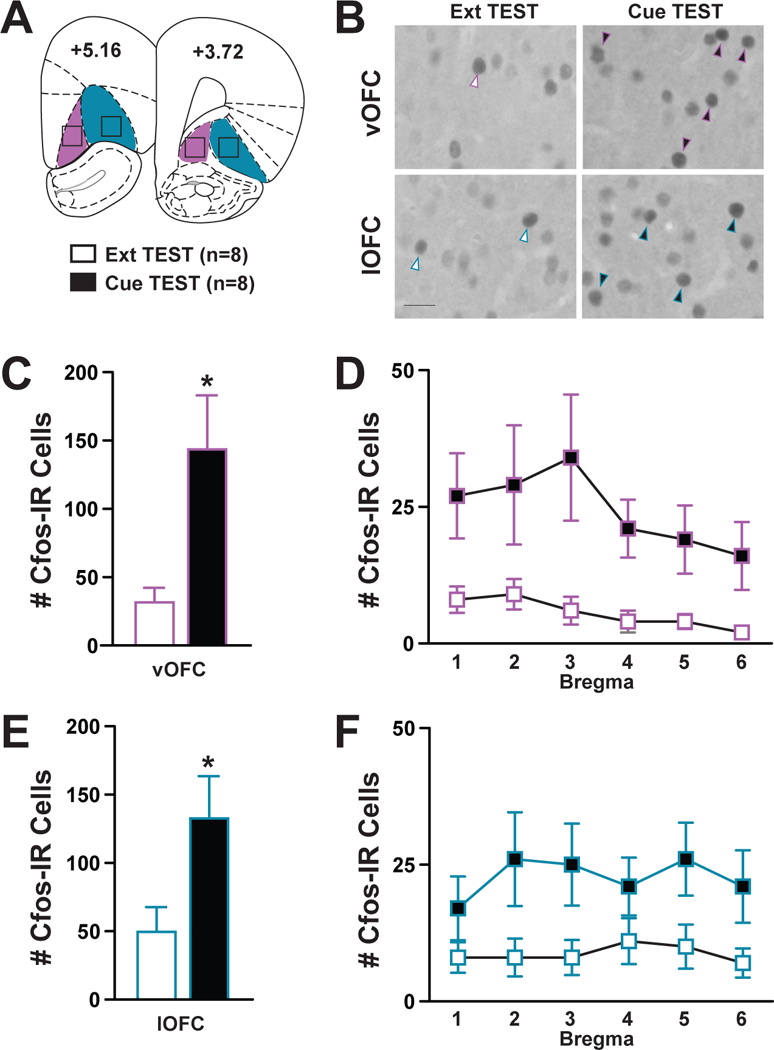
Figure 2:

Analysis of Cfos-immunoreactive (IR) Cells following Cue-Induced Reinstatement Behavior. (A) Schematic depicting the representative region of OFC: vOFC (magenta), lOFC (blue) in which Cfos-IR cells were quantified at 6 bregma points from +5.16 to +3.72. (B) Representative images of darkly-stained Cfos-IR cells (arrows) within the vOFC or the lOFC between the Ext and Cue TEST groups; scale bar=100 μm, images taken at 20X magnification. (C, D) Number of Cfos-IR cells in the vOFC separated by bregma. (E, F) Number of Cfos-IR cells in the lOFC separated by bregma. *represents significant effect between subjects. White bars=Ext TEST Group, n=8; Black bars=Cue TEST group, n=8.
