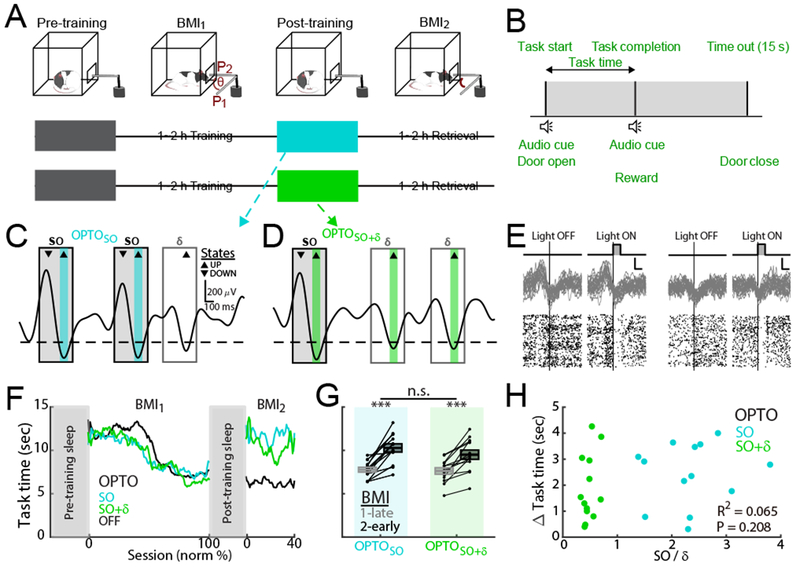
Figure 2. Optogenetic inhibitions during SO up-states.

(A) Flow charts for OPTOSO and OPTOSO+δ experiments.
(B) Rats learned direct neural control of a feeding tube (θ = angular position in ‘A’). Successful trials required movement from P1 to P2 within 15 sec.
(C and D) Examples of filtered traces (0.1-4 Hz) and stimulation periods (100 ms pulses) during up-states of SO and SO+δ for OPTOSO (C) and OPTOSO+δ experiments (D).
(E) Examples of 30 raw LFP traces and spike rasters (left: SO up-states; right: δ wave up-states). Scale bars indicates 100 ms on x-axis and 2 s.d. on y-axis of raw LFP.
(F) Example learning curves for OPTOSO, OPTOSO+δ and OPTOOFF.
(G) Mean task time changes from BMI1-Late to BMI2-Early (mean in solid line ± s.e.m. in box; OPTOSO: n = 13 sessions, 5 rats, mixed-effects model, t24 = 6.99, ***P < 10−6; OPTOSO+δ: n = 13 sessions, 7 rats, mixed-effects model, t24 = 5.52, ***P < 10−4; OPTOSO vs. OPTOSO+δ: mixed-effects model, t24 = −1.39, P = 0.18).
(H) Relationship of mean task time change in ‘G’ to the ratio of SO to δ-triggering (n = 26 sessions, 12 rats; linear regression, R2 = 0.065, P = 0.208).
See also Figures S1 and S2.
