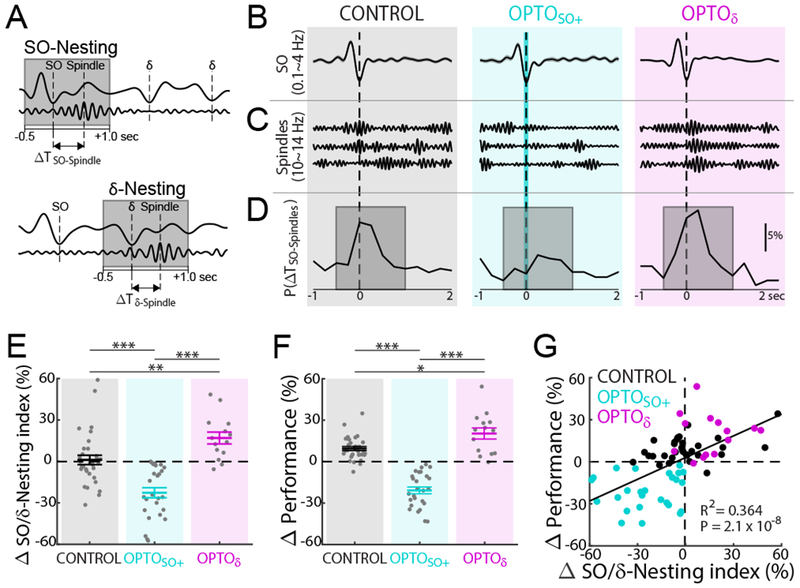
Figure 4. Spindle to SO nesting and changes in task performance.

(A) Cartoon of nesting of spindle to SO (SO-Nesting; top) and δ (δ-Nesting; bottom). Gray boxes indicate the time window for ‘nesting’, −0.5 to 1.0 sec from up-state (same as ‘D’).
(B) Example of mean SO-up-state-triggered LFP (top, mean ± s.e.m., 0.1~4 Hz) for CONTROL, OPTOSO+, and OPTOδ.
(C) Single trial examples of detected spindles near SOs.
(D) Examples of probability distribution of spindle-peaks time from nearest SO up-state (ΔSO-Spindles). Examples of probability distribution for ΔTδ-Spindles are shown in Figure S3B.
(E) SO/δ-Nesting index changes from pre- to post-training sleep (mean ± s.e.m.; CONTROL: n = 32 sessions, 12 rats; OPTOSO+: n = 26 sessions, 12 rats; OPTOδ: n = 14 sessions, 5 rats; one-way ANOVA, F2,69 = 25.36, P < 10−8; significant post hoc t tests, corrected for multiple comparison, **P < 0.01, ***P < 10−3).
(F) Task performance changes from BMI1-Late to BMI2-Early (positivity represents performance improvement) (CONTROL: n = 32 sessions, 12 rats; OPTOSO+: n = 26 sessions, 12 rats; OPTOδ: n = 14 sessions, 5 rats; one-way ANOVA, F2,69 = 76.08, P < 10−17; significant post hoc t tests, corrected for multiple comparison, *P < 0.05, ***P < 10−3).
(G) Relationship between SO/δ-Nesting index changes and task performance changes (total n = 72 sessions, 12 rats; significant linear regression, R2 = 0.354, P = 3.5 × 10⁻⁸; satisfies criteria for linear regression, see Methods).
See also Figures S3, S4, and S5.
