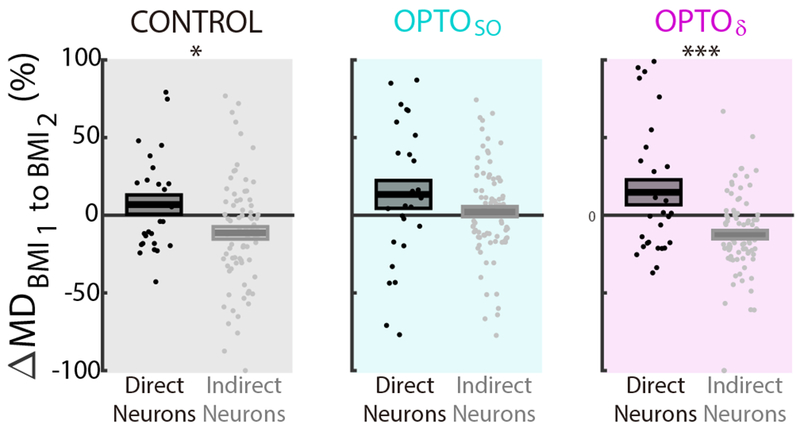
Figure 7. Rescaling of task activations.

Rescaling of direct and indirect neurons measured through modulation depth changes (ΔMD) from BMI1 to BMI2 during CONTROL, OPTOSO, and OPTOδ (mean in solid line ± s.e.m. in box; CONTROL: n = 13 sessions, 5 rats, mixed-effects model, t101 = −2.38, *P = 0.038; OPTOSO: n = 13 sessions, 5 rats, mixed-effects model, t106 = −1.44, P = 0.153; OPTOδ: n = 14 sessions, 5 rats, mixed-effects model, t116 = −4.16, ***P < 10−4; corrected for multiple comparison). Data from Rat ID 1-5 in Table S1 analyzed here.
See also Figure S7.
