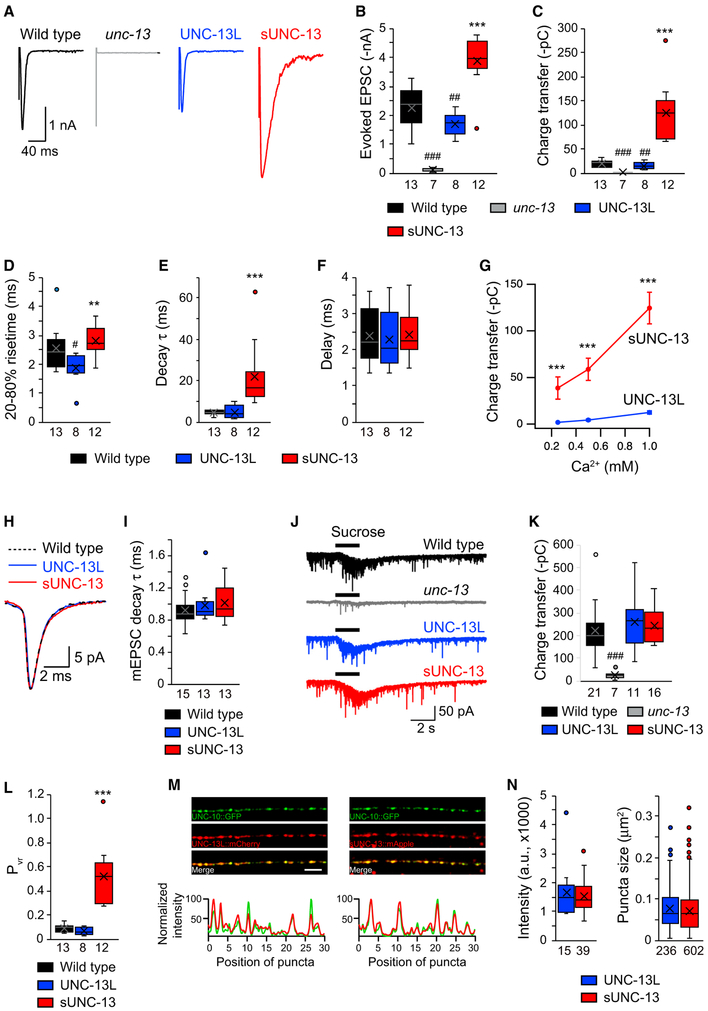
Figure 3. sUNC-13 Increases Evoked Neurotransmitter Release without Changing the RRP.
(A) Example traces of stimulus-evoked EPSCs recorded in 1 mM Ca2+ from wild-type (black), UNC-13L rescue (blue), and sUNC-13 rescue (red) animals.
(B–F) Quantification of the evoked EPSC amplitude (B), charge transfer (C), 20%–80% rise time (D), decay (E), and delay (F) from the same genotype as in (A).
(G) Evoked EPSCs recorded from various Ca2+ levels (0.25, 0.5, and 1 mM) from UNC-13L (blue) and sUNC-13 (red) rescue animals.
(H) Example traces of averaged mEPSCs from the indicated genotypes.
(I) Quantification of the decay τ of the mEPSCs.
(J) Hypertonic sucrose-evoked current recorded from wild-type (black) and unc-13 mutants rescued by UNC-13L (blue) or sNC-13 rescue (red).
(K) Averaged charge transfer from the sucrose-evoked currents in (H).
(L) Quantification of the probability of synaptic vesicle release (Pvr) from the indicated genotypes.
(M) Top: representative confocal z stack images for UNC-13L and UNC-10/RIM (left) and sUNC-13 and UNC-10/RIM (right). Scale bar, 5 μm. Bottom: line scans along the dorsal nerve cord.
(N) Quantification of the fluorescence intensity and punctum size of UNC-13L::mApple and sUNC-13::mApple.
Data in (G) are presented as mean ± SEM, and all other data are shown as box-and-whisker plots with median (line) and mean (cross) indicated. #p < 0.05, ##p < 0.01, ###p < 0.001 compared with the wild type; **p < 0.01, ***p < 0.001 compared with UNC-13L rescue; Student’s t test for data in (G), one-way ANOVA following Kruskal-Wallis test for data in (B) and (C), and one-way ANOVA for all other data. The number of worms analyzed for each genotype is indicated under each box.

