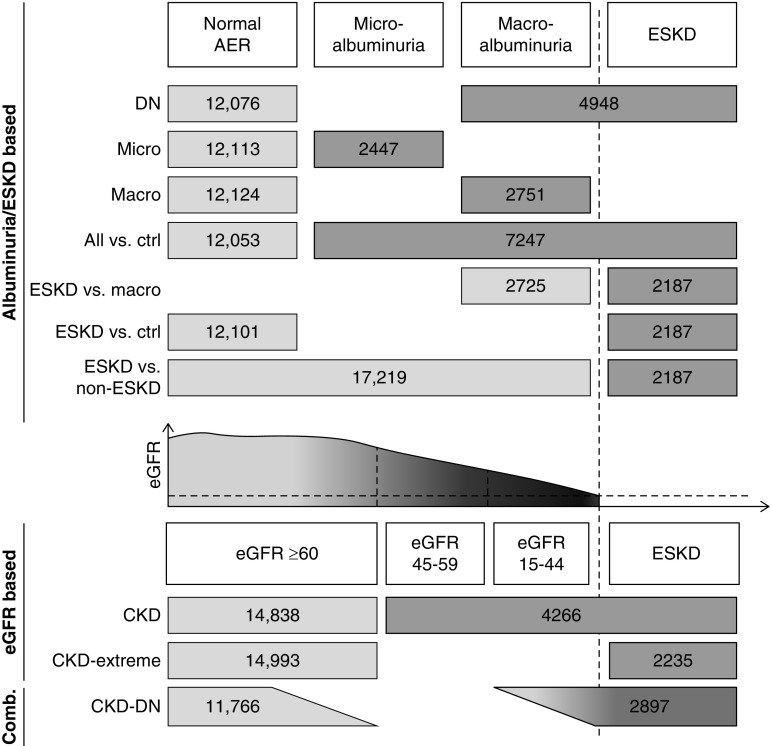
Figure 1.
Phenotypic analysis of DKD. Schematic diagram of outcomes analyzed in this study. Numbers indicate the total number of cases (darker gray) and controls (lighter gray) included in the meta-analyses for each phenotype. ESKD defined as eGFR<15 ml/min per 1.73 m2 or undergoing dialysis or having renal transplant.

