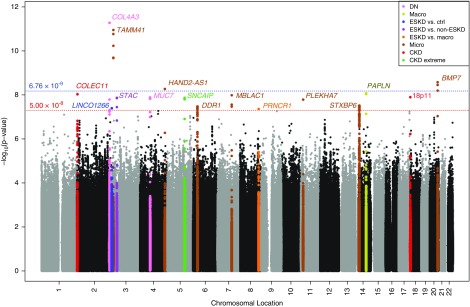
Figure 2.
Genome-wide association testing of all ten phenotypic comparisons. Multiphenotype Manhattan plot shows lowest P value at each marker for each of the ten phenotypic comparisons, under the standard and fully-adjusted model. Significance of SNPs (−log10[P value], y axis) is plotted against genomic location (x axis). Loci surpassing genome-wide significance (red line) and/or study-wide significance (blue line) are colored by phenotype.

