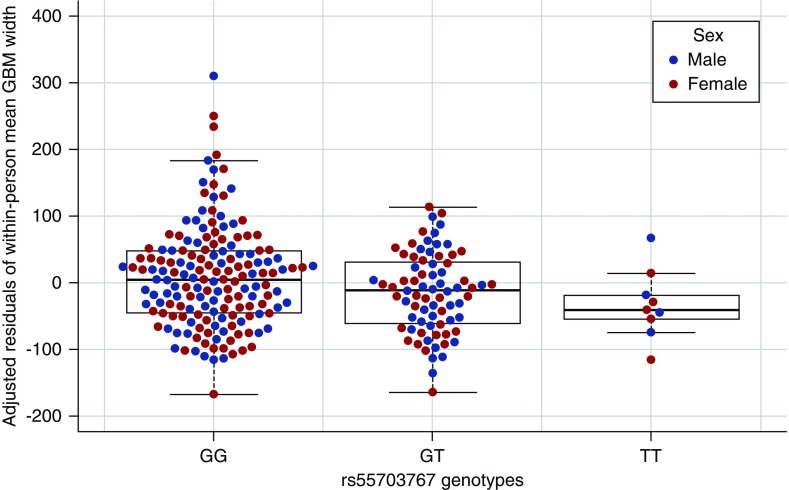
Figure 3.
Adjusted residuals of GBM width by rs55703767 genotype and sex. Box and whisker plot of residuals of mean GBM width after adjusting for age, sex, and diabetes duration, stratified by GG, GT, or TT genotype at rs55703767, with overlay of individual data points for both women (pink) and men (blue).

