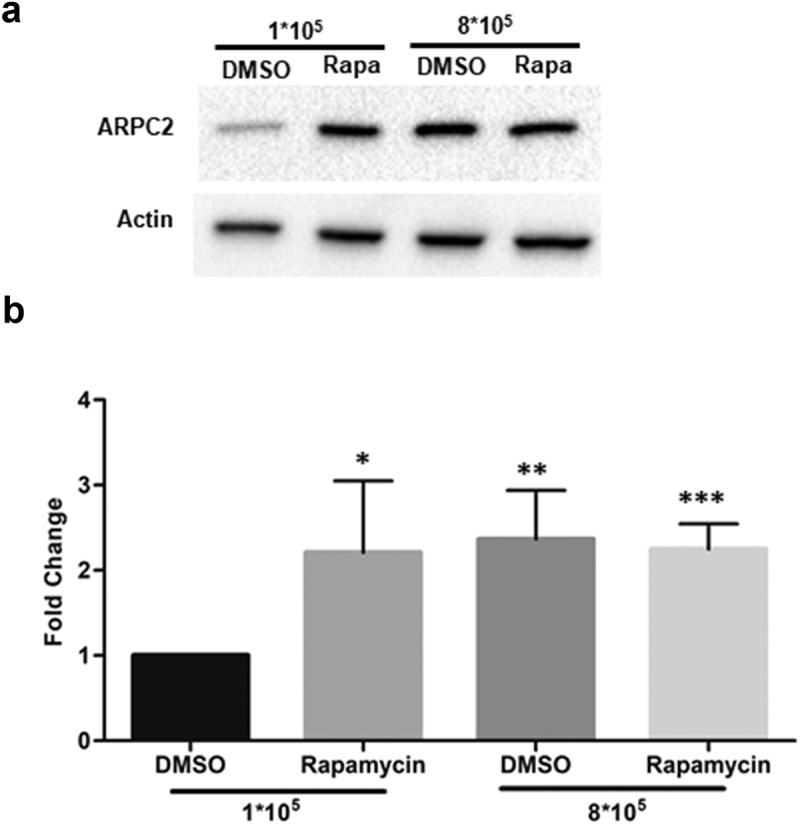
Figure 3.

Rapamycin treatment of MCF7 cells. MCF7 cells (1*105 and 8*105 cells per well) were seeded in 6-well plates, cultured for 16 h, treated with 10 µM rapamycin and harvested 8 h thereafter. a) Western blotting of ARPC2 compared to actin. b) Quantification of band intensities. Values for ARPC2 are relative to those of the β-actin and were normalized to the DMSO control. Alterations in expression levels are represented as fold change ± SD of three independent experiments.
