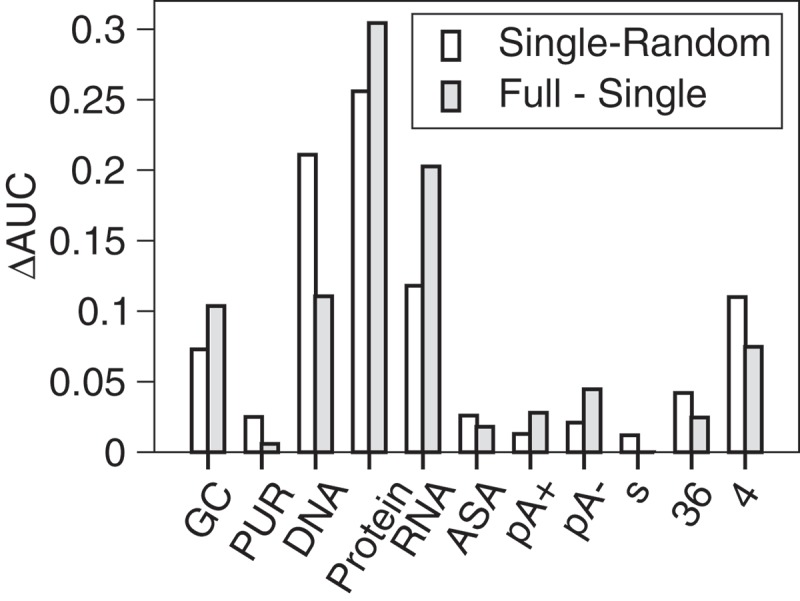
Figure 3.

The difference in Area Under the ROC Curve (AUC) as a single feature. Here, GC denotes GC content; PUR: Purine content; DNA: DNA conservation; Protein: Protein conservation; RNA: RNA conservation; ASA: Accessible surface area; pA+: polyA+ RNA-seq; pA-: polyA- RNA-seq; s: small RNA-seq; 36: H3K36me3 modification; and 4: H3K4me3 modification. The difference is multiplied by 10 for removing a single feature only (filled bar), to facilitate comparison to the results of using a single feature (open bar).
