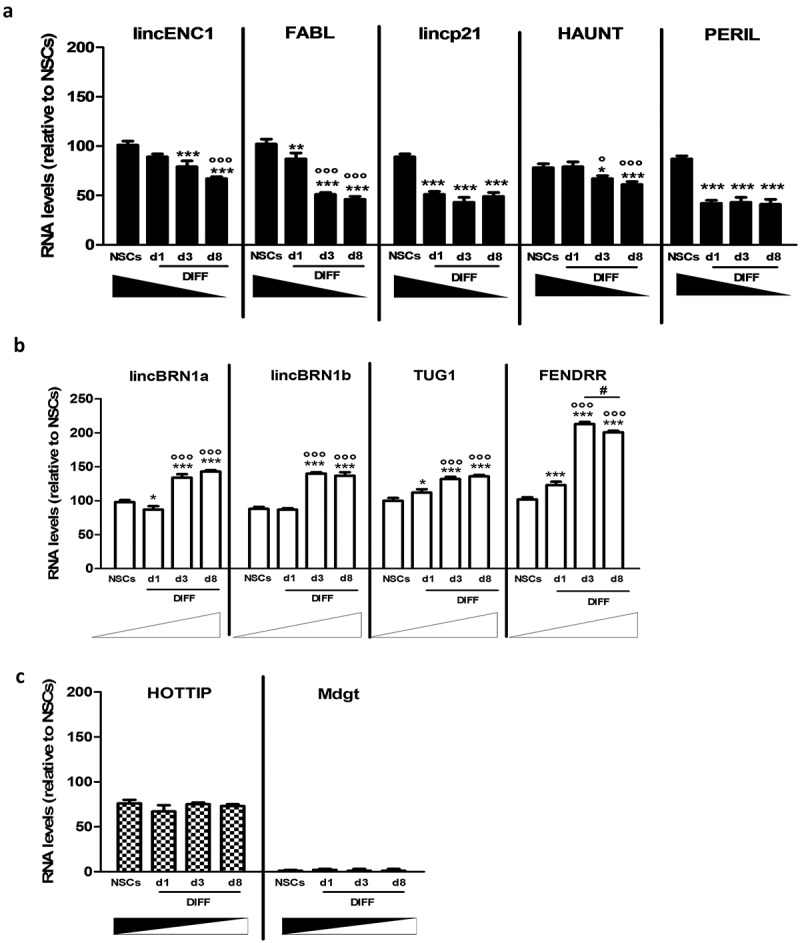
Figure 1.

Expression analysis of a pool of lncRNAs during mice NSCs differentiation.
(a). LincENC1, FABL, lincp21, HAUNT and PERIL expression levels were analyzed in neurospheres (NSCs) and at different time points during the differentiation process (d1, d3, d8 DIFF). These lncRNAs decrease during the differentiation process. Quantification was performed by real time-PCR using GAPDH as housekeeping gene. Results are expressed as mean of three different experiments ± SD (*p < 0.05, **p < 0.01, ***p < 0.001 vs NSCs; °p < 0.05, °°°p < 0.001 vs d1).(b). LincBRN1A, lincBRN1B, TUG1 and FENDRR expression levels were analyzed in neurospheres (NSCs) and at different time points during the differentiation process (d1, d3, d8 DIFF). These lncRNAs increase during the differentiation process. Quantification was performed by Real Time-PCR using GAPDH as housekeeping gene. Results are expressed as the mean of three different experiments ± SD (*p < 0.05, ***p < 0.001 vs NSCs; °°°p < 0.001 vs d1; #p < 0.05 vs d3).(c). Hottip and Mdgt expression levels were analyzed in neurospheres (NSCs) and at different time points during the differentiation process (d1, d3, d8 DIFF). These lncRNAs stay stable during the differentiation process. Quantification was performed by real time-PCR using GAPDH as housekeeping gene. Results are expressed as the mean of three different experiments ± SD.
