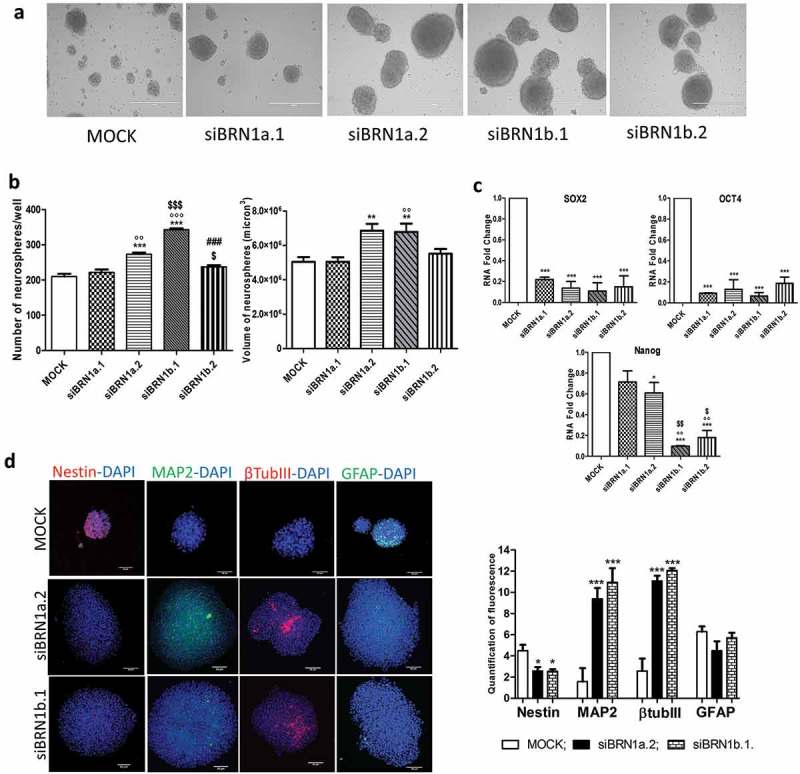
Figure 2.

Silencing of lincBRN1a and lincBRN1b in NSCs.
(a). In vivo direct light images (EVOS FL microscope, Euroclone) of neurospheres maintained in stem cells medium for 8 days in standard floating conditions (MOCK) or in the presence of silencing agents for lincBRN1a (siBRN1a.1 and siBRN1a.2) and lincBRN1b (siBRN1b.1 and siBRN1b.2). Scale bar 400 μm. Images are representative of what has been observed in three different experiments.(b). The histograms report the neurospheres’ number and dimensions, respectively, in standard conditions (MOCK), and in the presence of silencing agents for lincBRN1a (siBRN1a.1 and siBRN1a.2) and lincBRN1b (siBRN1b.1 and siBRN1b.2). The number of neurospheres was calculated as the number of spheroids formed by 104 seeded NSCs in the different conditions. The dimension was reported as volume measured by means of ImageJ software culture picture analysis. Pictures are representative of three different experiments. Quantifications were repeated in triplicate for each experiment and data is reported as mean ± SD (**p < 0.01, ***p < 0.001 vs MOCK; °°p < 0.01, °°°p < 0.001 vs siBRN1a.1; $p < 0.05, $ p < 0.001 vs siBRN1a.2; ###p < 0.001 vs siBRN1b.1).(c). The histograms report the mRNA expression levels of SOX2, Nanog and OCT4 in standard conditions (MOCK), and in the presence of silencing agents for lincBRN1a (siBRN1a.1 and siBRN1a.2) and lincBRN1b (siBRN1b.1 and siBRN1b.2). Quantification was performed using GAPDH as housekeeping gene. Results are expressed as mean ± SD of three independent experiments (*p < 0.05, ***p < 0.001 vs MOCK; $ p < 0.05, [Math Processing Error] p < 0.01 vs siBRN1a.1; °°°p < 0.001 vs siBRN1a.2).(d). Confocal images of neurospheres marked with Nestin (red), Map2 (green), βTubIII (red) and GFAP (green) in standard conditions (MOCK), and in the presence of silencing agents for lincBRN1a (siBRN1a.2) and lincBRN1b (siBRN1b.1). DAPI (blue) was used as counter-staining. Scale bar 50 μm. The graph reports the quantification of fluorescence intensity made by ImageJ picture analysis software. Pictures are representative of three different experiments performed with siBRN1a.2 and siBRN1b.1 but similar results were obtained with siBRN1a.1 and siBRN1b.2. Quantifications was repeated in triplicate for each experiment (3 fields/experiment) and data have been reported as mean ± SD (*p < 0.05; *** p < 0.001 vs MOCK).
