Figure 3.

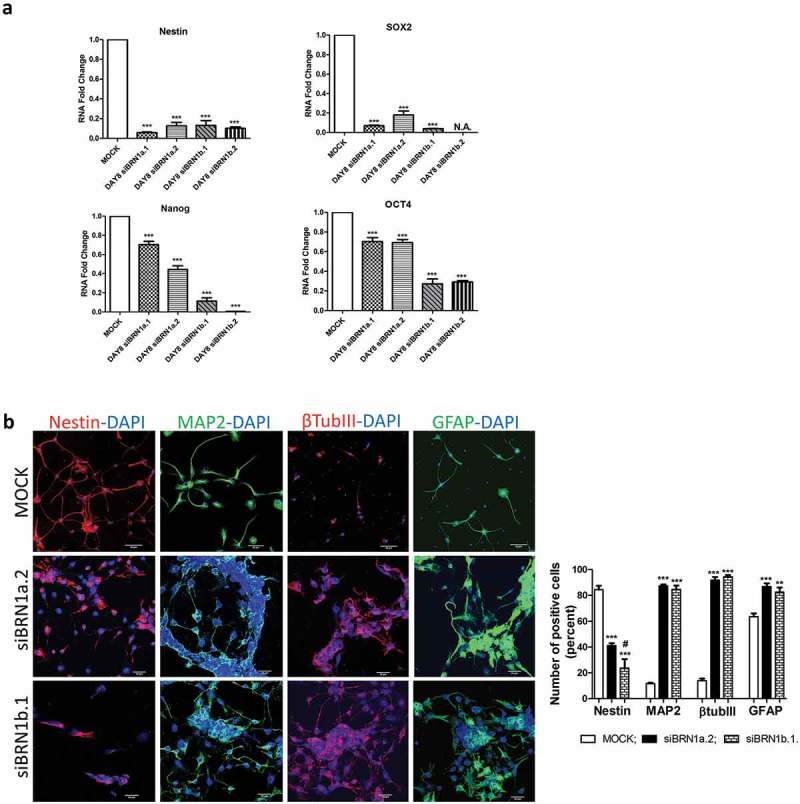
Silencing of lincBRN1a and lincBRN1b in differentiated NSCs.
(a). The histograms report the mRNA expression levels of Nestin, SOX2, Nanog and OCT4 in standard conditions (MOCK), and in the presence of silencing agents for lincBRN1a (siBRN1a.1 and siBRN1a.2) and lincBRN1b (siBRN1b.1 and siBRN1b.2). Quantification was performed using GAPDH as housekeeping gene. Results are expressed as mean ± SD of three independent experiments (***p < 0.001 vs MOCK).(b). Confocal images of differentiated NSCs marked with Nestin (red), Map2 (green), βTubIII (red) and GFAP (green) in standard control conditions (MOCK), and in the presence of silencing agents for lincBRN1a (siBRN1a.2) and lincBRN1b (siBRN1b.1). DAPI (blue) was used as counter-staining. Scale bar 50 μm. The graph reports the quantification of fluorescence intensity made by ImageJ picture analysis software. Pictures are representative of three different experiments. Quantifications were repeated in triplicate for each experiment and data have been reported as mean ± SD (** p < 0.01, *** p < 0.001 vs MOCK; # p < 0.05 vs siBRN1a.2). Pictures are representative of three different experiments performed with siBRN1a.2 and siBRN1b.1 but similar results were obtained with siBRN1a.1 and siBRN1b.2.
