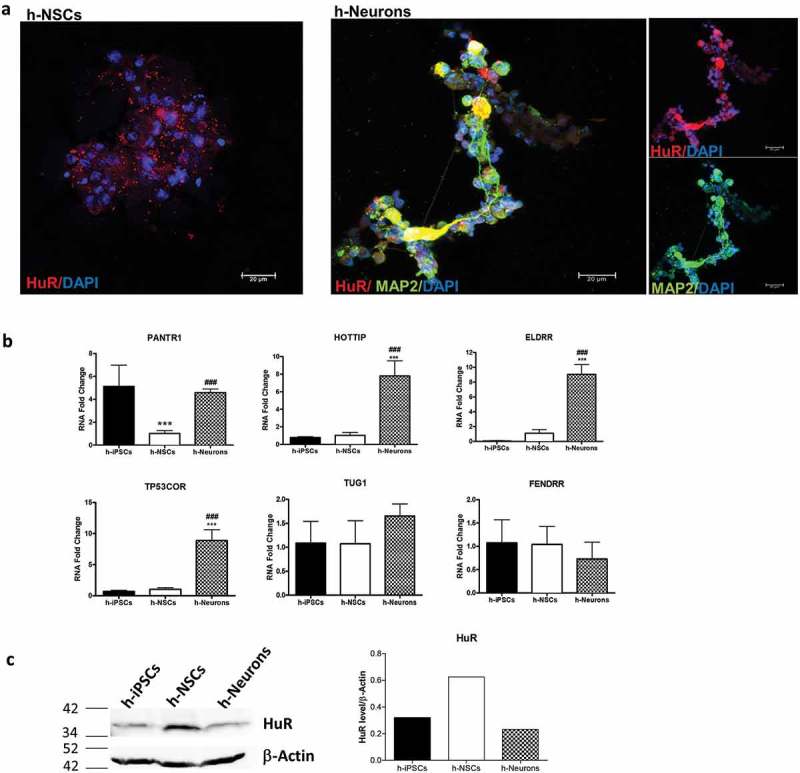
Figure 8.

Expression of HuR and human homologues of lncRNAs during neuronal differentiation of h-iPSCs.
(a). Immunofluorescence analysis of HuR (red) and MAP2 (green) in h-NSCs and h-Neurons. DAPI (blue) was used as counter-staining. Scale bar 20 µm. (b). Expression analysis of human homologues of lncRNAs PANTR1, HOTTIP, ELDRR TP53COR, TUG1 and FENDRR in iPSCs (h-iPSCs), NSCs (h-NSCs) and neurons (h-Neurons). Quantification was performed by means of Real Time-PCR using GAPDH as housekeeping gene. Results are reported as mean ± SD (***p < 0.001; vs h-iPSCs, ###p < 0.001 vs h-NSCs n = 3).(c). Western blot analysis of HuR’s expression in h-iPSCs, h-NSCs and h-Neurons (NSCs). ß-Actin was used as the loading control. The histogram shows the band intensity quantification, measured by means of ImageJ software picture analysis.
