Figure 6.

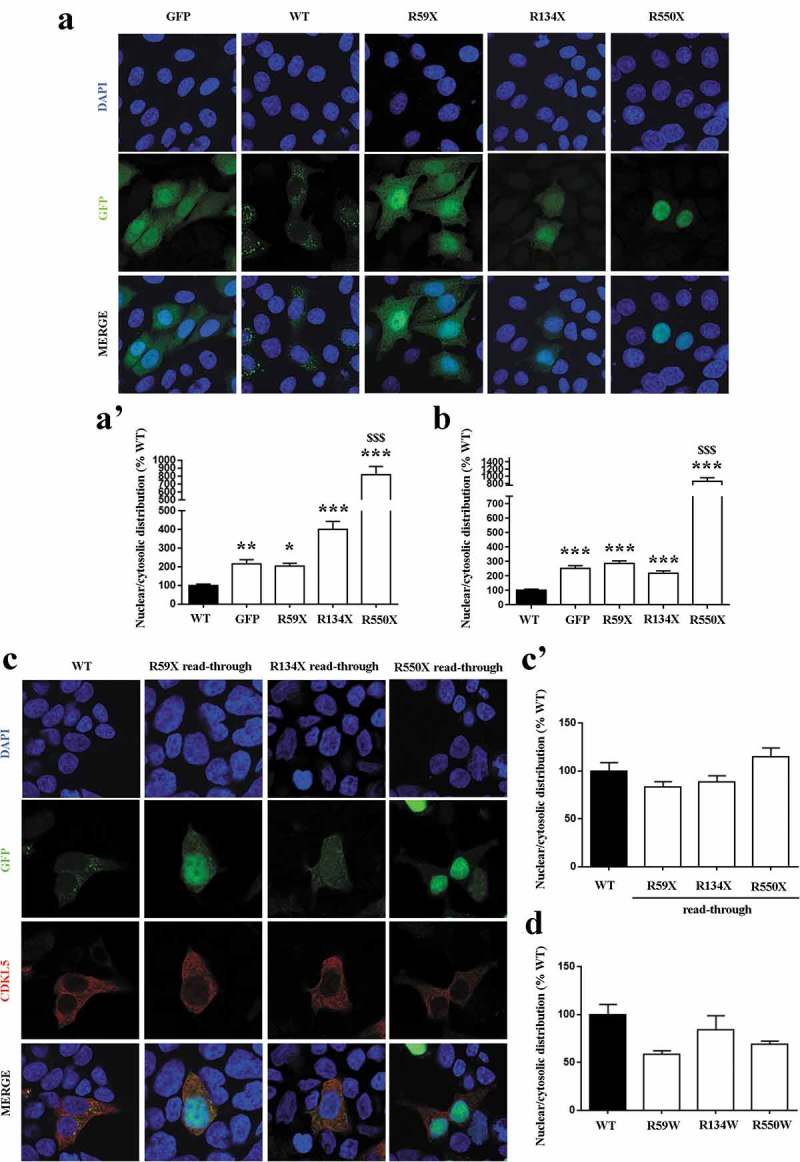
(a, b) Analysis of the nuclear/cytosolic distribution of WT and mutant CDKL5 in transfected HeLa cells (a, a’) and HEK293T (b). Representative immunofluorescence of CDKL5 in cells transfected with WT GFP-CDKL5 and its truncated derivatives R59X, R134X and R550X. GFP transfected cells served as control. Histograms depict the analysis of nuclear/cytosolic distribution of CDKL5, calculated by measuring the integrated density of GFP fluorescent signal in the two cellular compartments and expressed as the mean ± SEM of the percentages with respect to WT (*p < 0.05, **p < 0.01, ***p < 0.001vsWT; $$$p < 0.001vsGFP, by one-way ANOVA, followed by Dunn post hoc test). (c, c’) Analysis of the nuclear/cytosolic distribution of mutant CDKL5 following read-through treatment. Representative immunofluorescence of nuclei (blue), GFP-CDKL5 (green) and full-length CDKL5 (red) in transfected HEK293T cells. Histogram depicts the analysis of the nuclear/cytosolic distribution of full-length CDKL5 after exposure with G418 (2000 µg/ml for 24 h), reporting the mean ± SEM of the percentages of calculated integrated density with respect to WT. (d) Analysis of the nuclear/cytosolic distribution of full-length CDKL5 derivatives containing a tryptophan residue at the level of the selected PTCs. Histogram depicts the mean ± SEM of the percentages of calculated integrated density respect to WT.
