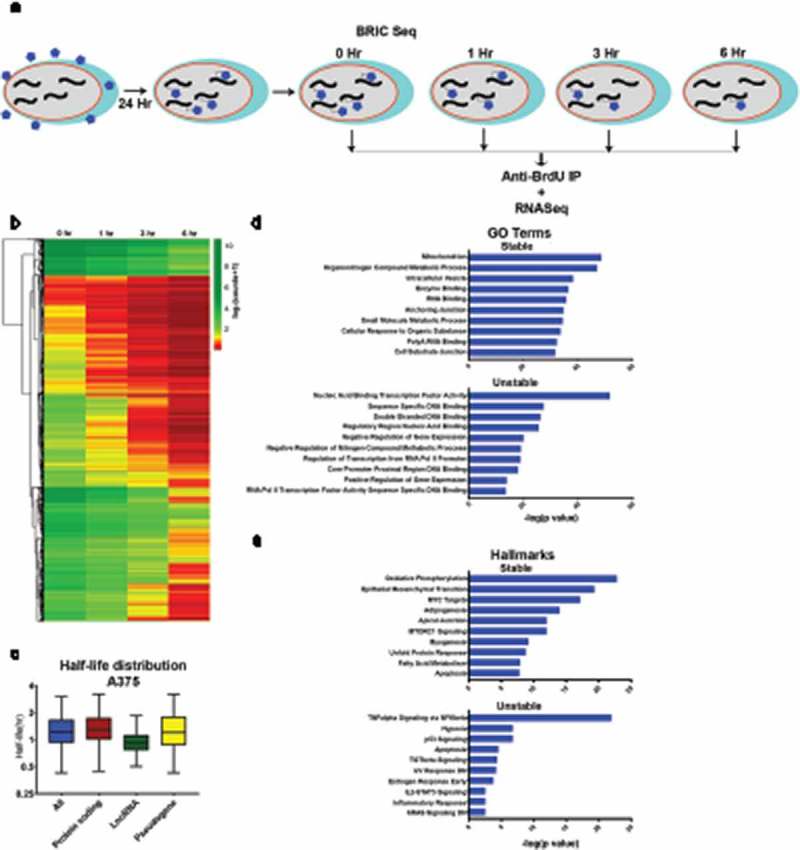
Figure 1.

Transcriptome decay profile of the amelanotic melanoma cell line A375. A) Schematic of BRIC-seq ([10], see Methods). BrU-labelled RNA is collected at defined intervals after initial incubation to identify transcriptome-wide decay rates. B) Heatmap of normalized read counts and depicting decay profiles of all the filtered transcripts. Unsupervised hierarchical clustering represents subgroups clustered based on decay profile. C) Box plots showing the half-life distribution (in hours) of all the transcripts and transcript species as calculated from the filtered data. D) Gene ontology (GO) analysis showing top 10 GO terms associated with the 5% most highly stable (top) and 5% most highly unstable (bottom) protein-coding transcripts. E) Hallmark analysis showing top 10 hallmarks associated with the 5% most highly stable (top) and 5% most highly unstable (bottom) protein-coding transcripts.
