Figure 2.

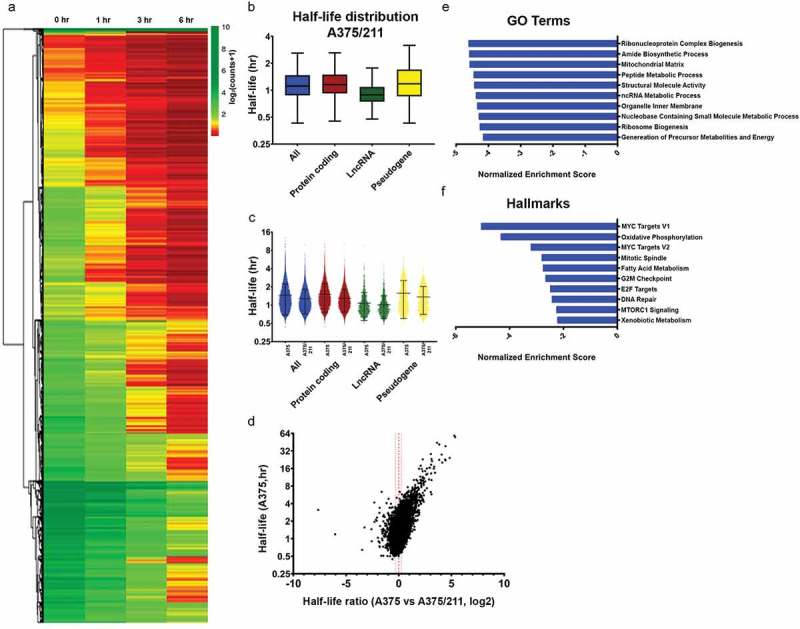
miR-211 destabilizes transcriptome stability in A375 cells. A) Heatmap of normalized read counts depicting decay profiles of all the filtered transcripts for A375/211 cells. Hierarchical clustering represents subgroups clustered based on decay profiles. B) Box plots showing the half-life distribution (in hours) of all the transcripts and transcript species as calculated from the filtered data for A375/211 cells. C) Violin plot depicting half-lives of each individual transcript for different RNA species between A375 and A375/211 cells. D) Volcano plot depicting the correlation between half-life of a transcript in control A375 cells and the change in half-life upon miR-211 induction in A375/211 cells. The majority of transcripts are destabilized upon miR-211 expression. Dashed line represent decay ratio 1 and dotted line depicts ±20% window. E) GSEA for gene ontology (GO) terms showing the top ten GO terms enriched for miR-211-driven destabilized transcripts with lower half-life (≤80%) compared to parental A375 cells. F) GSEA for hallmark terms showing the top ten hallmark terms enriched for miR-211 driven destabilized transcripts.
