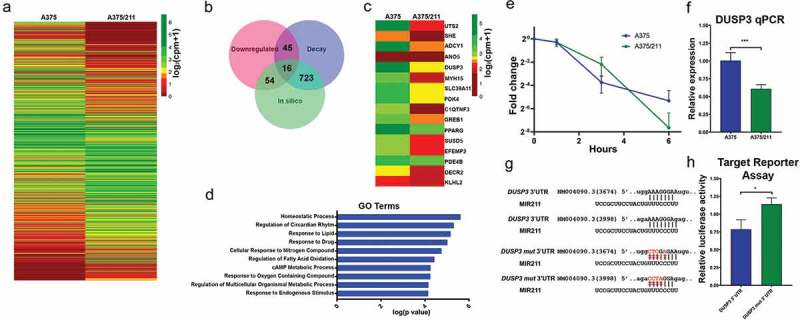
Figure 3.

Decay dynamics helps identify miR-211 targets in A375 cells. A) Heatmap showing normalized read counts comparing expression of significantly (two-fold change, FDR <0.1) differentially expressed protein-coding genes between A375 and A375/211 cells. B) Venn diagram showing the overlap between downregulated genes, destabilized genes, and in silico predicted gene targets. Seven hundred and twenty-three predicted targets decayed faster (half-life ratio A375 vs A375/211, ≥1.2) upon miR-211 induction; 54 predicted targets were downregulated and 45 faster decaying genes were downregulated. Altogether, 16 predicted targets were destabilized and downregulated. C) Heatmap plotting normalized read counts of selected miR-211 targets based on stringent criteria of overlap between destabilization, downregulation, and in silico prediction. D) Gene ontology (GO) analysis showing the top 10 GO terms enriched for direct miR-211 targets. E) Graph comparing decay profile of DUSP3 between A375 and A375/211 cells as calculated via BRIC-qPCR and showing that miR-211 reduces DUSP3 transcript half-life. F) qPCR validation of DUSP3 downregulation upon miR-211 induction in A375 cells. G) In silico predicted miR-211 target sites in the DUSP3 3ʹ UTR. H) In vitro validation of miR-211-dependent DUSP3 3ʹ UTR decay via a luciferase-based mi-RNA reporter assay. * p < 0.05; *** p < 0.001.
