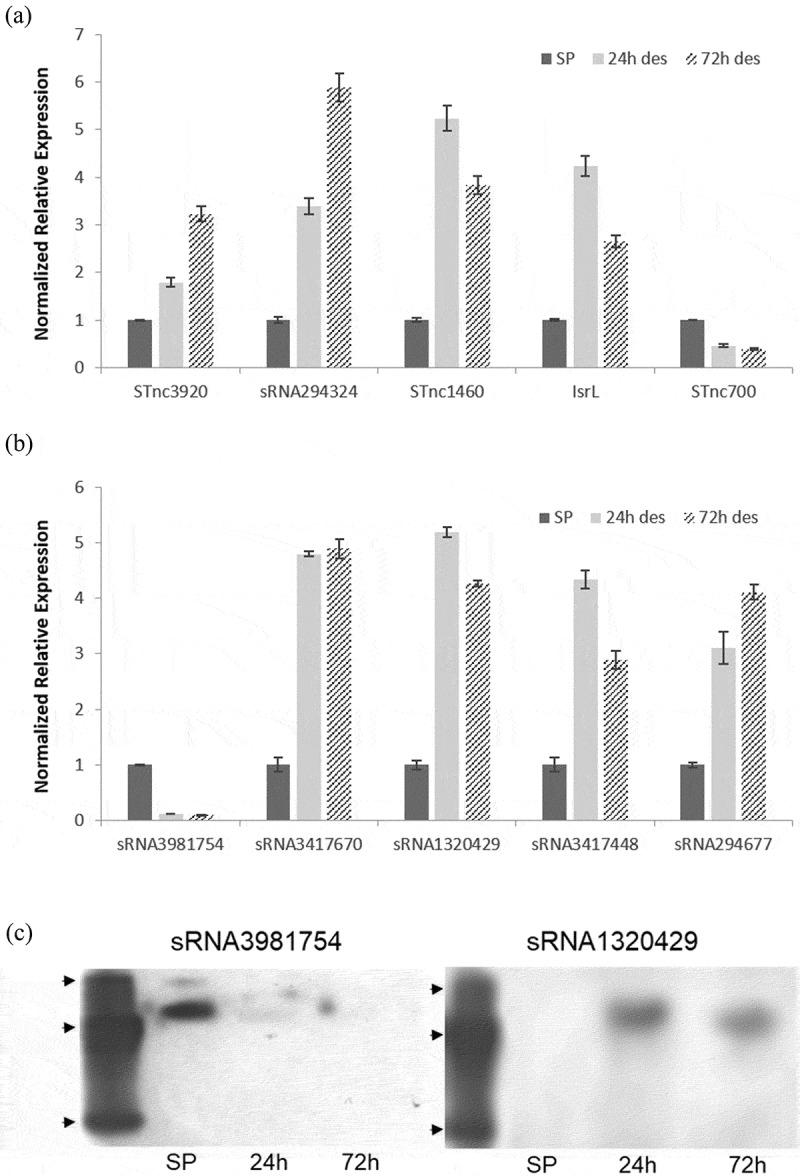
Figure 4.

qRT-PCR and small transcript northern validation of sRNA differential expressions. (a) Annotated sRNA qPCR expressions. (b) Putative sRNA qPCR expressions. The specificity of each amplification was verified via melting curves, and a control without reverse transcriptase was included in parallel. Gene expressions were calculated via the Delta-Delta cycle threshold method [56]. SP, stationary phase; 24 h des, 24 h desiccated; 72 h des, 72 h desiccated. Expressions were normalized to SP. Error bars in A and B indicate SD (n = 3). (c) sRNA3981754 (left) and sRNA1320429 (right) small transcript northern blot. Arrowheads indicate 25, 50 and 200 nt oligonucleotide bands in custom ssDNA 5ʹ biotinylated ladder. SP, stationary phase. 24 h, 24 h desiccated. 72 h, 72 h desiccated.
