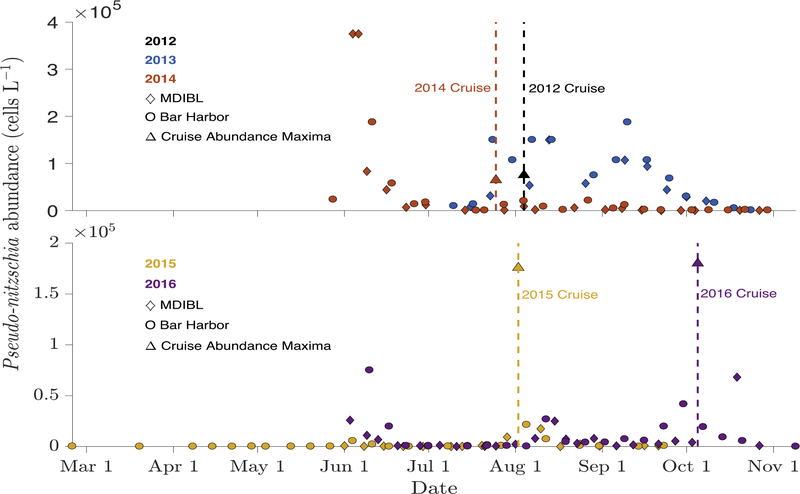
Figure 2 -.
From the MDIBL and Bar Harbor time series data, Pseudo-nitzschia spp. cell concentration versus time in 2013, 2014, 2015, and 2016. Timing of the 2014, 2015, and 2016 cruises are indicated with vertical lines. Maximum total cell abundance from each cruise is plotted as a single point. Note that the y axis scales are different.

