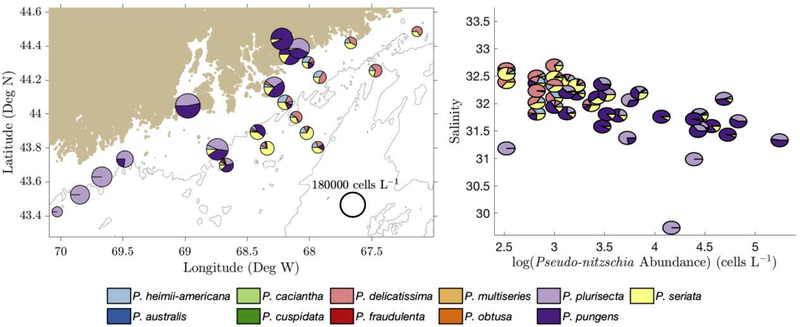
Figure 6 -.
(Left) August 2015 species relative abundance of surface samples plotted on the sampling locations in the GOM. Pie chart size was determined by log(cell count) (scale shown at lower right). (Right) 2015 relative species abundance on a salinity vs. cell count diagram, with axes scaled to match Figure 4, Figure 5, and Figure 7.

