Figure 4.
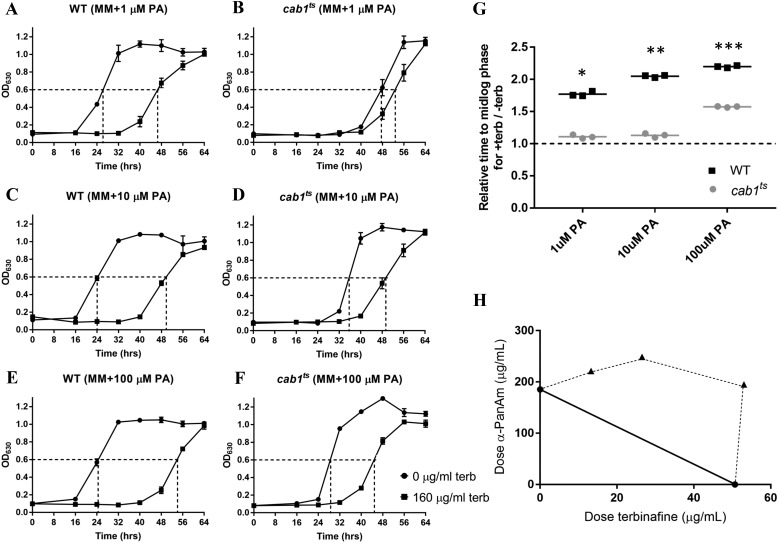
Relationship between pantothenate utilization and yeast susceptibility to terbinafine. A–F, growth curves of WT and cab1ts cells without or with 160 μg/ml terbinafine (terb) in liquid minimal medium supplemented with varying concentrations of pantothenic acid. MM, minimal medium. G, relative times for treated WT and cab1ts cells to reach mid-log phase compared with untreated cells, calculated from A. Time for untreated cells to grow to mid-log was normalized to 1 and is represented by the dashed line. Comparing the WT with cab1ts growth at each PA concentration provides significant results. *, p value < 0.0001; **, p value < 0.0001; ***, p value < 0.0001. H, isobologram of the interaction between terbinafine and the pantothenate analog α-PanAm (n = 2). The solid line represents the theoretical curve of an additive effect. Data above the solid line (dashed curve) show antagonism between the two compounds. Error bars represent SD.

