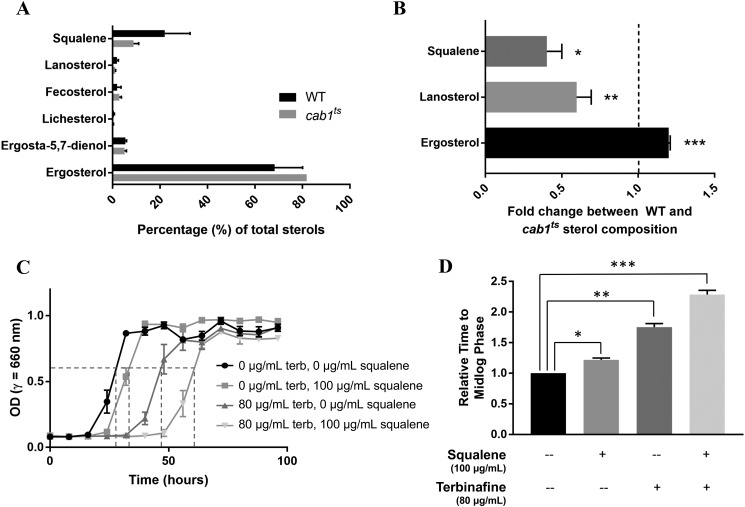
Figure 6.
Effect of altered pantothenate phosphorylation on cellular sterol levels and sensitivity to terbinafine. A, the most prominent ergosterol precursors in the ergosterol biosynthetic pathway were chosen for analysis in both WT and cab1ts cells. B, levels of squalene, lanosterol, and ergosterol in WT cells were normalized to 1 and are represented by the dashed line on the graph. Bars denote the -fold change in the relative level of each sterol in cab1ts cells compared with WT. *, p value 0.0088; **, p value 0.0185; ***, p value 0.0009. C, growth of WT cells in defined liquid media with 100 μm PA supplemented with squalene, terbinafine (terb), or both (n = 3). D, relative times of treated cells to grow to mid-log phase compared with untreated cells, calculated from values in Fig. 6C. Untreated cells were normalized to 1. *, p value 0.0017; **, p value 0.0002; ***, p value < 0.0001. Error bars represent SD.

