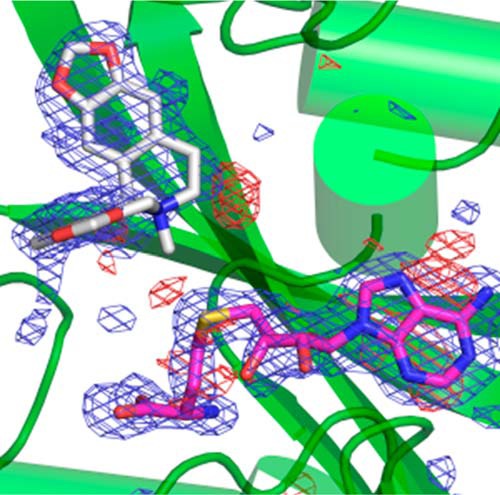
Figure 7.

Omit electron density map of SAH (magenta) and SMS (light gray) bound to GfTNMT. The refined |Fo| − |Fc| electron density map was calculated after removing the coordinates for the two ligands and refining the structure for 20 cycles. The map is shown at a contour level three standard deviations above the mean. Note the absence of electron density for a methyl group attached to the sulfur atom of SAH, confirming the transfer of a methyl group from the substrate SAM initially present in the crystallization mixture. Also note the weaker electron density around the N-methyl group and ring C of the isoquinoline ring of SMS. The electron density for this part of the isoquinoline ring is better defined at lower contour levels. Positive electron density is shown as a blue mesh, and negative electron density is shown as a red mesh.
