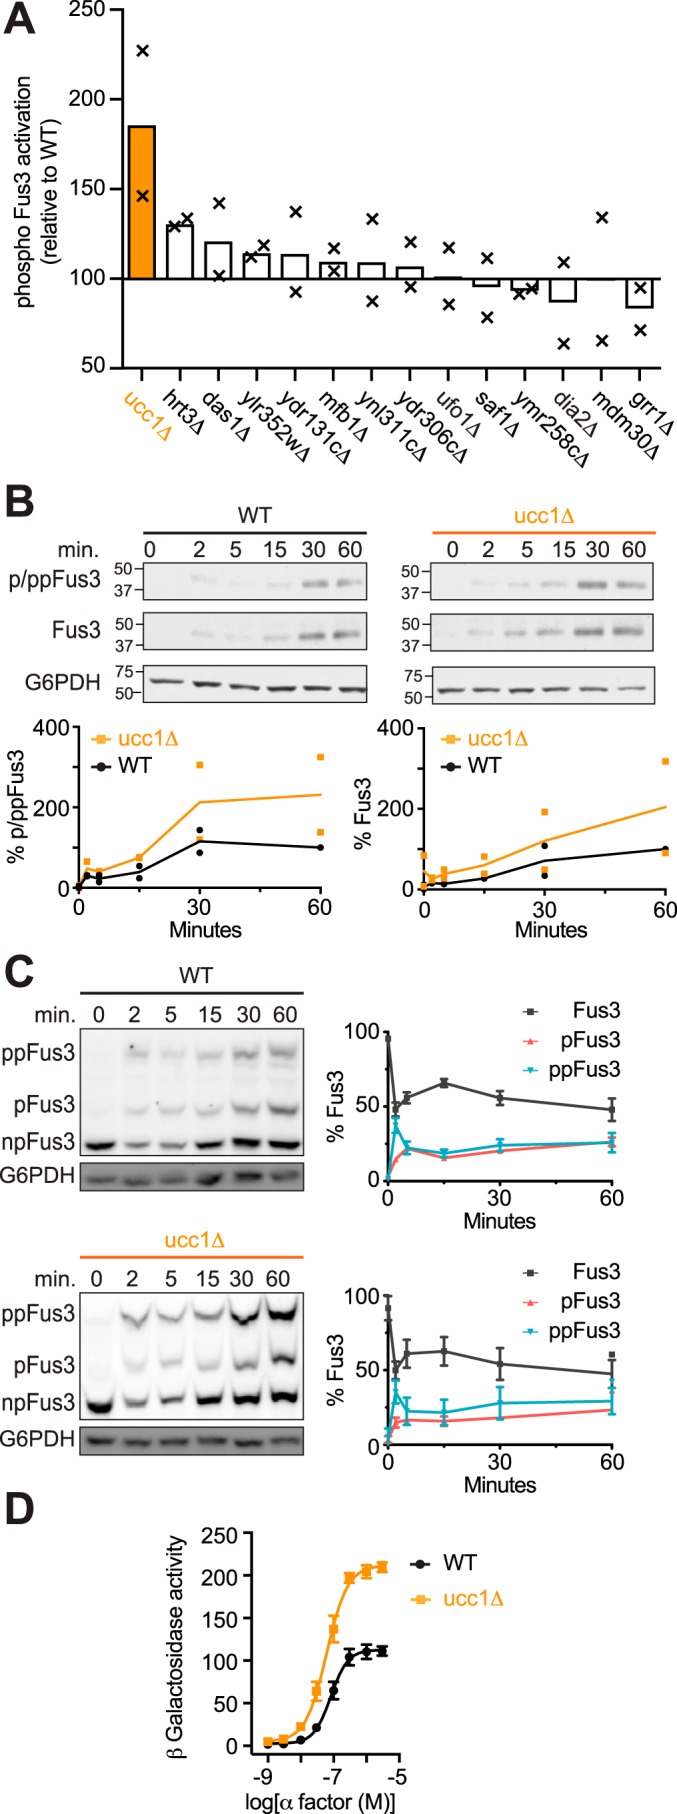
Figure 4.

F-box protein Ucc1 promotes MAPK induction. A, F-box screen. Bars represent average phospho-MAPK (Fus3) activation relative to BY4741 (WT). Cells were treated with 3 μm α-factor for 60 min and analyzed by immunoblotting with phospho-p44/42 antibodies to detect activated Fus3. B, time course of Fus3 activation. WT and ucc1Δ cells were treated with 3 μm α-factor and analyzed by immunoblotting with phospho-p44/42 (p/pp-Fus3), Fus3, and G6PDH (load control) antibodies. C, Phos-tag immunoblot analysis of WT and ucc1Δ cells treated with α-factor and analyzed by immunoblotting, as described in B. Protein bands (left) representing dual-phosphorylated (ppFus3), mono-phosphorylated (pFus3), and nonphosphorylated (Fus3) forms of the protein were quantified using ImageJ and presented as a percentage of total Fus3 at 0 min (right). D, β-gal activity in cells expressing the FUS1-lacZ transcription reporter and treated with 0–3 μm α-factor for 90 min. Data represent percentage of maximum activity relative to WT cells. A and B show individual data points (×) and the mean of two biological replicates; all other data are ± S.D.
