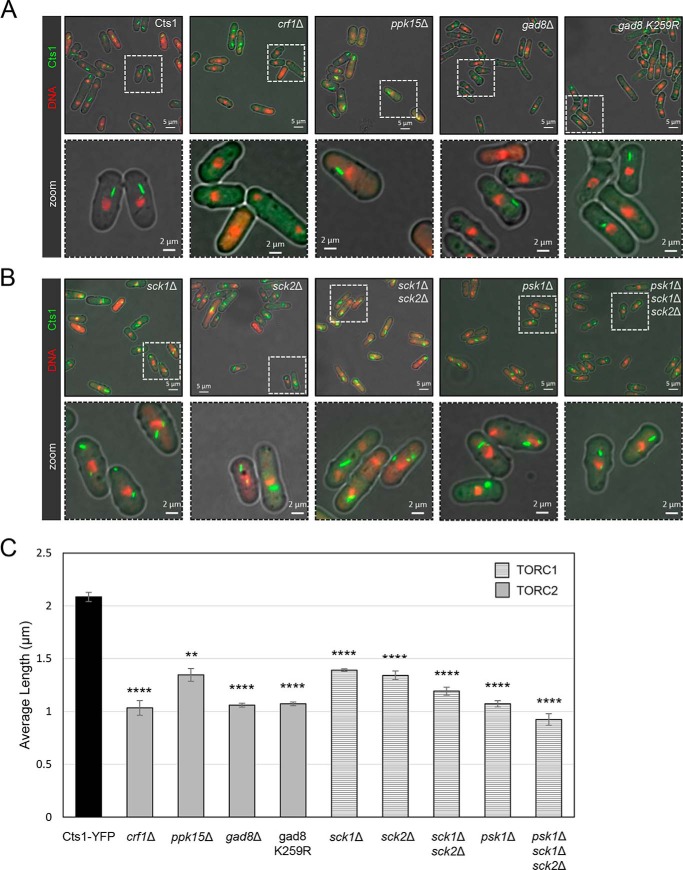
Figure 3.
Cytoophidium length is controlled by S6- and AGC kinase-mediated pathways downstream of TORC2 and TORC1. Cells were grown in rich medium until exponential phase, followed by fixation and observation of Cts1–YFP protein by fluorescence microscopy. A, representative images of control and mutant strains of TORC2 effectors (crf1Δ, ppk15Δ, gad8Δ, and gad8 K259R) are shown (top row), along with details of the cytoophidium morphology in a magnified area (bottom row). B, representative images of mutant strains of TORC1 effectors (sck1Δ, sck2Δ, sck1Δ sck2Δ, psk1Δ, psk1Δ sck1Δ sck2Δ) (top row) and localized magnified area (bottom row). C, the average length of cytoplasmic cytoophidia was calculated in each TOR effector mutant and plotted along with the average length of cytoophidia in the Cts1–YFP strain. The different pattern indicates participation in TORC1 or TORC2 complexes, as indicated. Error bars show the mean ± S.D.: as calculated from three independent experiments (the length of cytoophidia in >400 cells was manually measured per strain per trial; ****, p < 0.0001; **, p < 0.01). All TOR mutant strains were constructed in a Cts1–YFP background.

