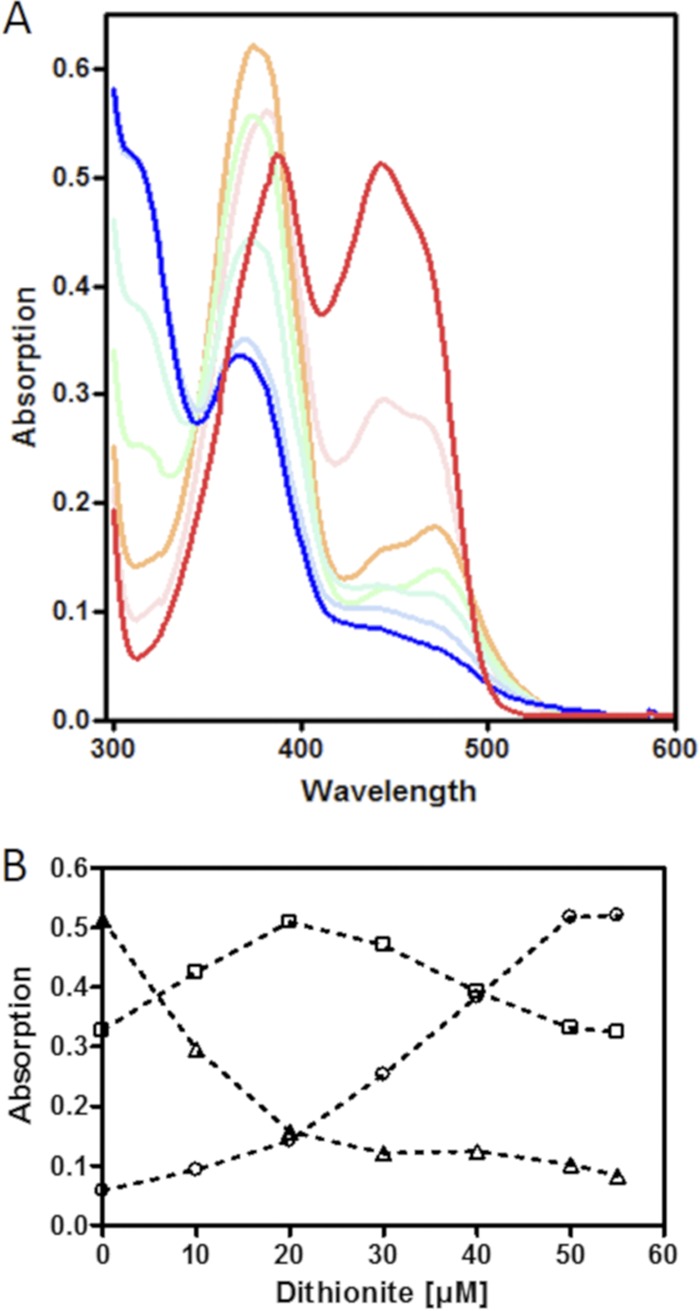
FIG 2.

UV-Vis spectroscopic characterization of ETFGm5. (A) UV-Vis spectral changes of purified ETFGm5 (60 μM) during reduction with dithionite from the fully oxidized form (red line) to the fully reduced form (blue line). Dithionite concentrations were increased by 10 μM between each measurement. (B) Tracings of the different redox stages of the protein by their maximum absorption values at representative wavelengths, as follows: oxidized FAD, 444 nm (triangles); semiquinone anion, 360 nm (squares); reduced FADH−, 311 nm (circles).
