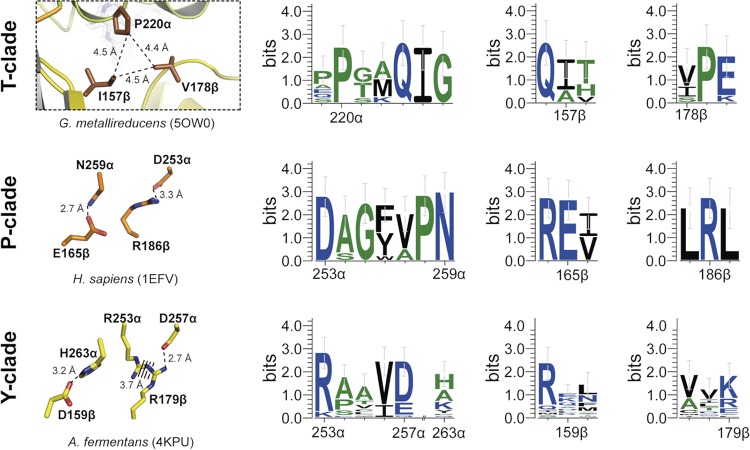
FIG 5.
Comparison of the hinge regions between domains II and III of ETF clades T, P, and Y. Structural details are shown in the left panels, and conservation of the relevant interacting amino acids within members of the respective clade is indicated in the right panels. Clade J was omitted because it contains too few members to produce statistically significant results. Broken lines indicate distances. The color scheme is as in Fig. 4. Sequence conservation patterns of relevant locations are based on the sequences from Fig. 6 using the numbering of the respective ETFs.

