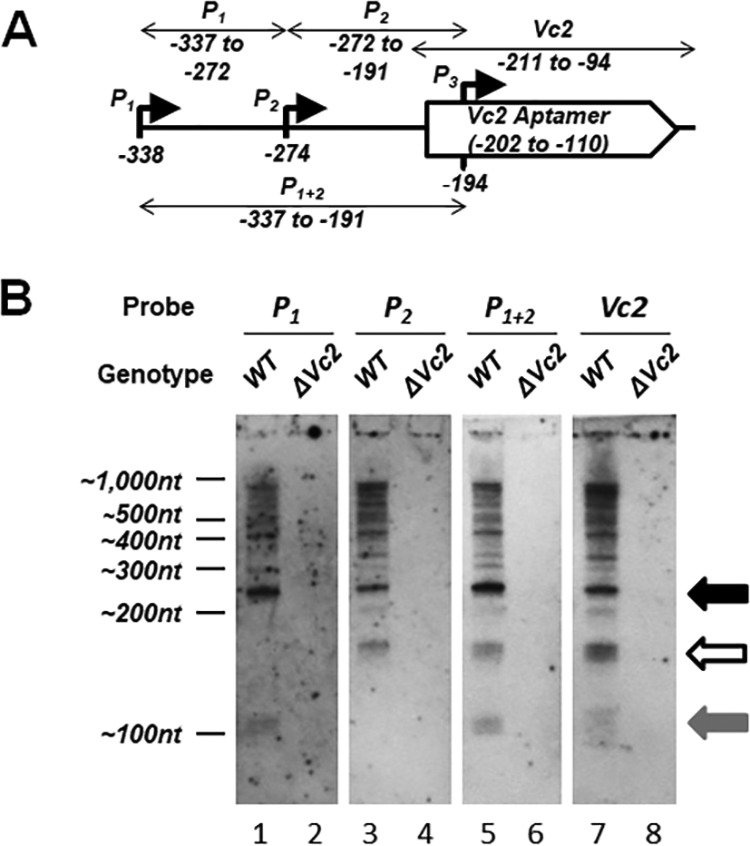
FIG 2.

Northern blot analysis of VC1721-tfoY intergenic region. (A) The location of the four RNA probes used for the Northern blot in panel B and Fig. 3. (B) Northern blot analysis of RNA extracted from either the WT or the ΔVc2 mutant V. cholerae. The locations of the ladder bands are shown to the left (nt, nucleotides). The black arrow shows P1-Vc2, the white arrow indicates P2-Vc2, and the gray arrow indicates the transcript from P1-tfoY to the terminator.
