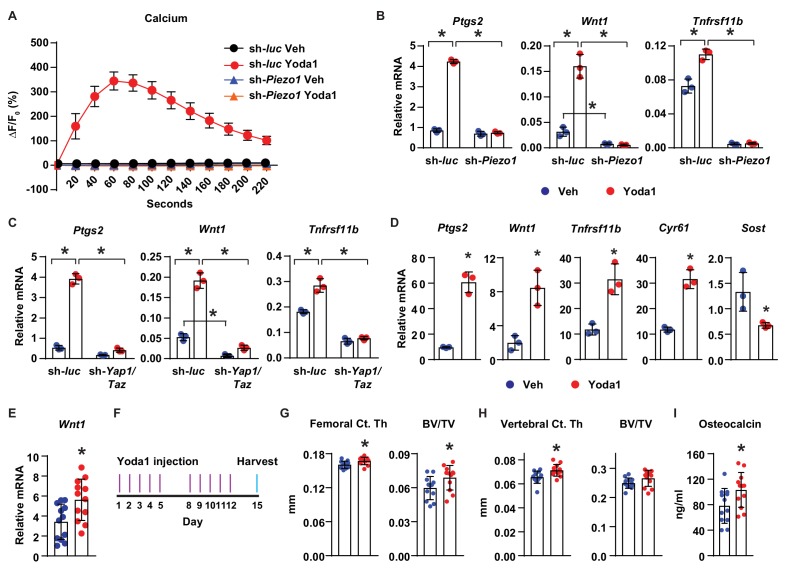
Figure 5. Activation of Piezo1 mimics the effects of mechanical stimulation on osteocytes.
(A) Intracellular calcium concentration measured in control or Piezo1 knock-down MLO-Y4 cells immediately after the treatment of DMSO or 10 µM Yoda1. (B) qPCR of Ptgs2, Wnt1, and Tnfrsf11b in control or Piezo1 knock-down MLO-Y4 cells treated with DMSO or 10 µM Yoda1 for 2 hr. n = 3 per group. *p<0.05 versus vehicle treated controls of the same genotype by 2-way ANOVA. (C) qPCR of Ptgs2, Wnt1, and Tnfrsf11b in control or Yap1/Taz knock-down MLO-Y4 cells treated with DMSO or 10 µM Yoda1 for 2 hr. n = 3 per group. *p<0.05 versus vehicle treated controls of the same genotype by 2-way ANOVA. (D) qPCR of Ptgs2, Wnt1, Tnfrsf11b, Cyr61, and Sost in ex vivo cultured femoral cortical bone from 5-week-old mice treated with DMSO or 10 µM Yoda1 for 4 hr. n = 3 per group. (E) qPCR of Wnt1 in tibia of C57BL/6J mice treated with Veh or Yoda1 for 4 hr. n = 12 per group. (F) Schedule of in vivo Yoda1 administration. (G, H) Cortical thickness and cancellous BV/TV in distal femur (G) and the 4th lumbar (H) of 4-month-old vehicle or Yoda1 treated female C57BL/6J mice (n = 12 per group). (I) Circulating osteocalcin levels in the serum of 4-month-old vehicle or Yoda1 treated female C57BL/6J mice (n = 12 per group). *p<0.05 versus vehicle treated controls by Student’s t-test.
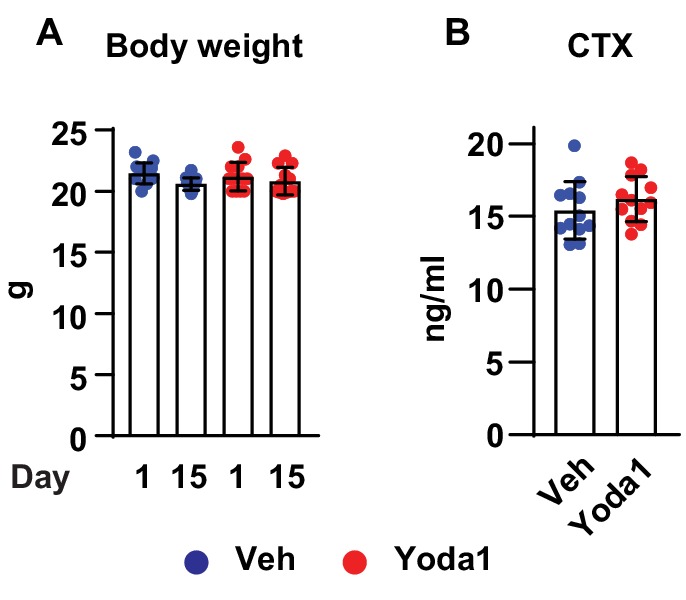
Figure 5—figure supplement 1. Yoda1 does not affect body weight and serum bone resorption marker.


