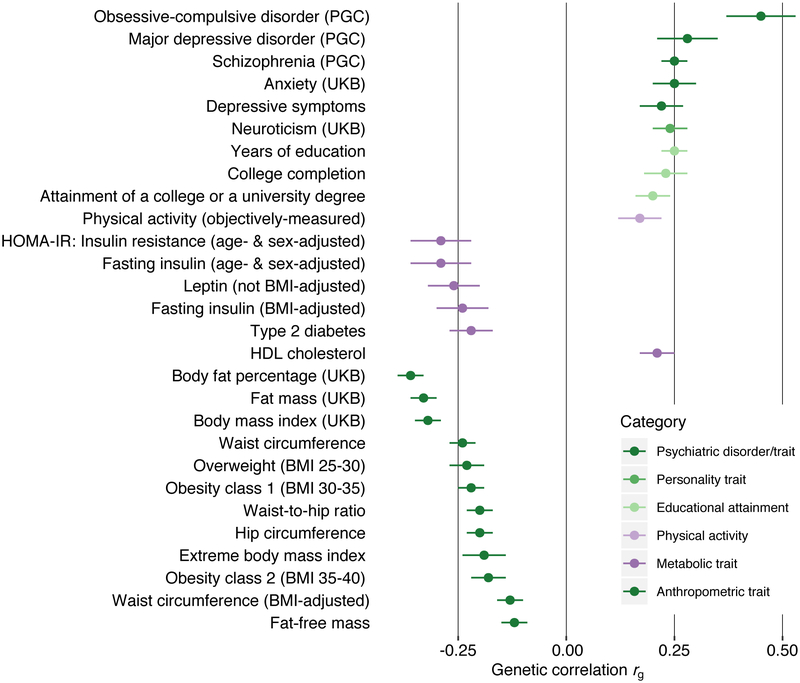
Figure. 2. Bonferroni-significant genetic correlations (SNP-rgs) and standard errors (error bars) between anorexia nervosa and other phenotypes as estimated by LD score regression.
Only traits with significant P values following Bonferroni correction are shown. Correlations with 447 phenotypes were tested (Bonferroni-corrected significance threshold P > 1.11 × 10⁻⁴). Complete results are shown in Table S10. PGC = Psychiatric Genomics Consortium, UKB = UK Biobank, HOMA-IR = Homeostatic model assessment - insulin resistance.

