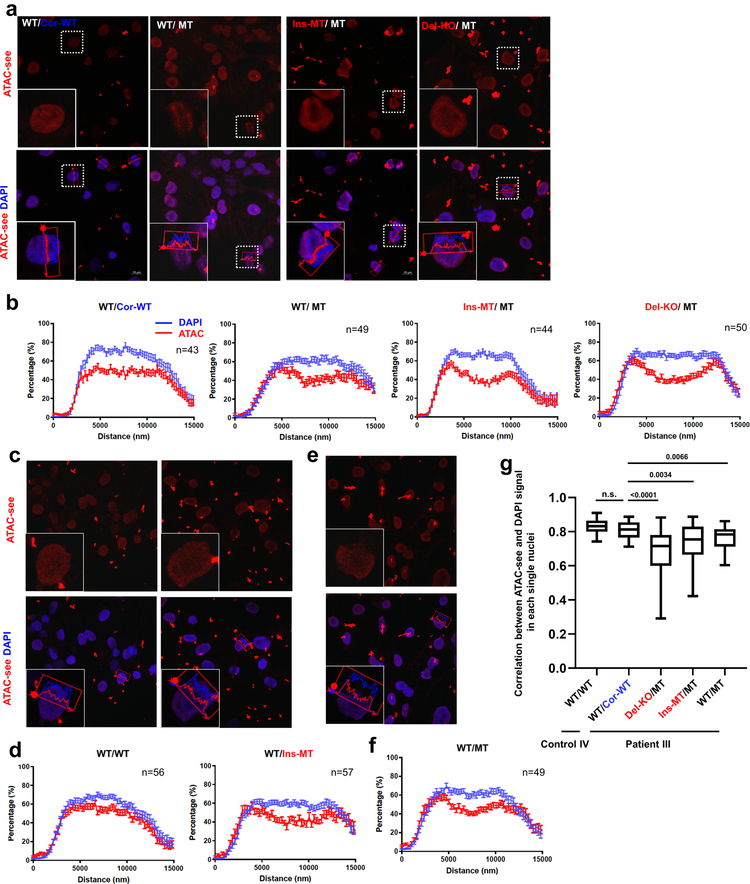
Extended Data Fig. 5. Haploinsufficiency of LMNA results in abnormal distribution of open chromatin in LMNA-mutant CMs.
a-f, Representative images and normalized signal intensity of ATAC-see and DAPI of control and mutant iPSC-CMs. Data were obtained from different patient lines, including Patient III-3 and its isogenic lines (a, b); Control IV-1 and its isogenic line (c, d); and Patient III-15 (e, f) for normalized signal intensity of ATAC-see and DAPI. Data are expressed as mean ± s.e.m. g, Correlation of signal distribution between ATAC-see and DAPI. n=42 (WT/WT), n=28 (WT/Cor-WT), n=33 (Del-KO/MT), n=32 (Ins-WT/WT), n=25 (WT/MT) for normalized signal intensity of ATAC-see and DAPI. Data are mean and minima to maxima, and two-tailed Student’s t-test was used to calculate P values. The experiments in a, c, and e were repeated three times independently with similar results.

