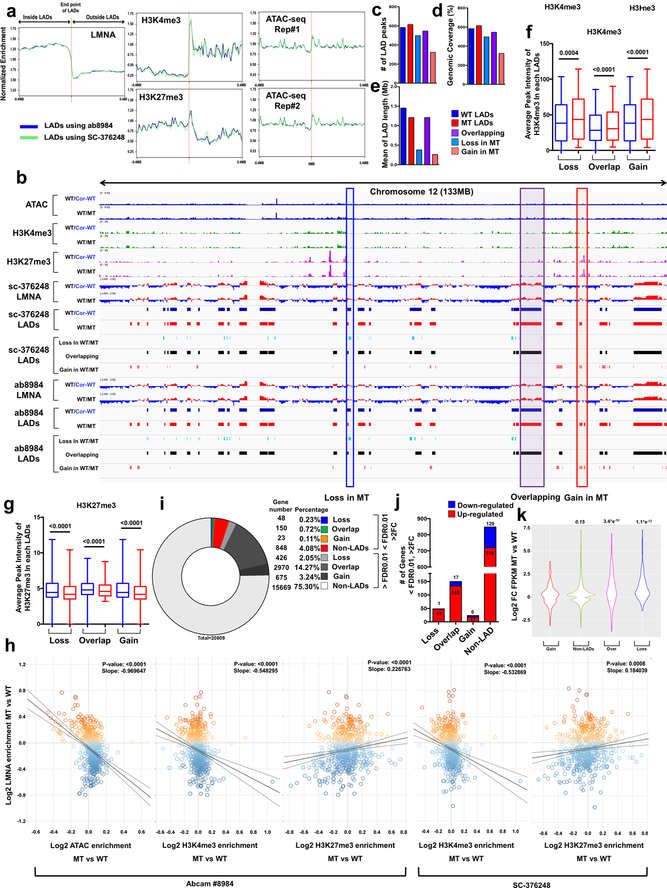
Extended Data Fig. 6. Genomic and chromatin features of LADs in control and mutant iPSC-CMs.
a, Normalized enrichment of LMNA ChIP-seq signals, histone markers (H3K4me3 and H3K27me3), and ATAC-seq signals within ± 0.4 mb of mapped LAD borders. The genomic locations of LADs were obtained from ChIP-seq on LMNA using two different antibodies (Abcam #8984; blue line, SC-376248; green line) in control iPSC-CMs (III-3). b, Representative images of ChIP-seq, ATAC-seq, and RNA-seq of chromosome 12 (133 MB). Red box represents LAD explicitly called in mutant iPSC-CMs (Gain). Purple box represents LADs called in both control and mutant iPSC-CMs (Overlapping). Blue box represents LADs explicitly called in control iPSC-CMs (Loss). c-e, (c) Number, (d) Genomic Coverage, and (e) Mean of length of LADs in control, mutant, gain, overlapping and loss LADs. ChIP-seq on LMNA (Abcam #8984) was used for data analysis. f, g, Average peak intensity of H3K4me3 and H3K27me3 of each LAD. n=184 (Loss), n=370 (Overlap), n=184 (Gain) for H3K4me3. n=273 (Loss), n=504 (Overlap), n=273 (Gain) for H3K27me3. Data are mean and minima to maxima, and Wilcoxon matched pairs signed rank test was used to calculate P values. h, Scatter plot of normalized LMNA, ATAC and histone markers (H3K4me3 and H3K27me3) enrichment of each LAD. Y-axis represents log2 relative normalized LMNA enrichment of each LAD in mutant iPSC-CMs as compared to control iPSC-CMs. X-axis represents log2 relative normalized ATAC and histone marks enrichment of each LAD in mutant iPSC-CMs as compared with control iPSC-CMs. Each data point represents one LAD. The statistical significance was obtained using one-way ANOVA. n=587 for SC-376248 and n=585 for Abcam #8984. i, percentage of differentially expressed gene in mutant iPSC-CMs as compared to control iPSC-CMs. j, Number of differentially expressed genes located in mutant iPSC-CMs as compared to control iPSC-CMs. (FDR <0.01; Log2FC >1 or <−1). k, Distribution of Log2 fold-change of FPKM in control and mutant iPSC-CMs. Statistical tests: Non-parametric Kruskal Wallis (testing for two-sided differences) followed by Dunn’s post-hoc for multiple comparison adjustment. n=266 (Gain), n=8171 (Non-LADs), n=835 (Overlap), n=206 (Loss).

