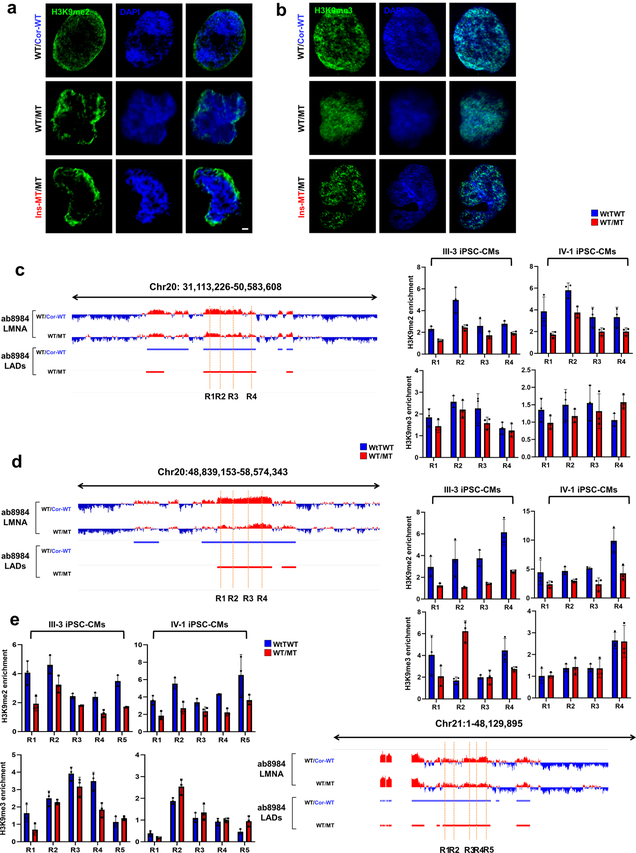
Extended Data Fig. 7. Abnormal distribution of H3K9methylation in mutant iPSC-CMs.
a, b, Representative images of IF staining of control mutant iPSC-CMs. iPSC-CMs were stained with specific antibodies for H3K9me2 or H3K9me3 (Green). Blue signal represents DAPI. Scale bar, 1000 nM. The experiments were repeated three times independently with similar results. c-e, Representative images of LMNA enrichment and LAD distribution of ChIP-seq data. ChIP-qPCR analysis of H3K9me2 and H3K9me3 enrichment on LAD region. Data are expressed as mean ± s.d. n=3.

