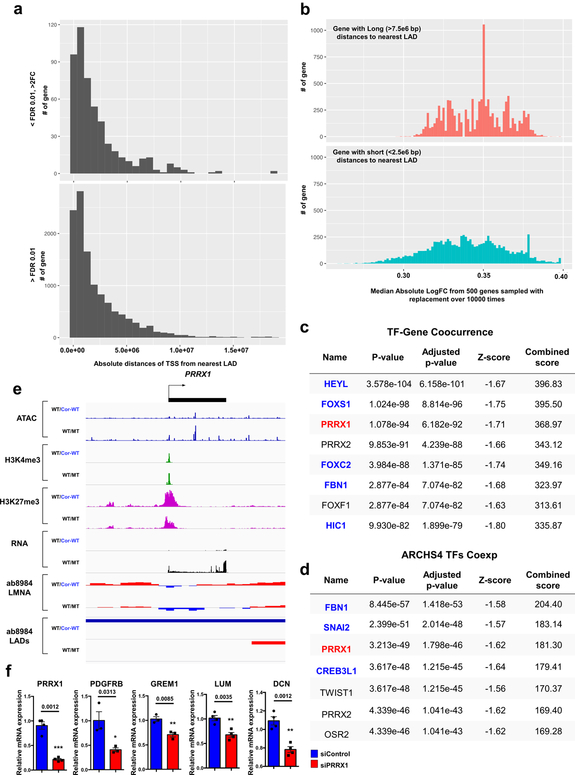
Extended Data Fig. 8. TFs altered by haploinsufficiency of LMNA contribute to the activation of genes located outside LADs.
a, Distribution of absolute distances to the nearest LAD (by nucleotide distance) from the TSS of genes that are differentially expressed (upper) or that show no significant difference in expression between mutant and control iPSC-CMs. b, Distribution of median absolute log2FC from genes with relatively long (>7.5e6 bp) distances to the nearest LAD (upper) and genes with relatively short (<2.5e6 bp) distances to the nearest LAD (lower). In each category, 500 genes were sampled with replacement over 10,000 times. c, d, TF-Gene Co-occurrence and ARCHS4 TFs Coexpression analyses of differentially expressed genes located in non-LADs. Blue color represents gene located in non-LADs. Black color represents no significant gene expression difference between control and mutant iPSC-CMs. Red color represents genes located in LADs and highly expressed in mutant iPSC-CMs as compared with control iPSC-CMs. Top 200 differentially expressed genes located in non-LADs were used for the analysis. e, Representative images of ChIP-seq, ATAC-seq, and RNA-seq of PRRX1 genomic region. f, Relative mRNA expression of PRRX1, PDGFRB, GREM1, LUM and DCN in mutant iPSC-CMs treated with scramble or PRRX1 siRNA. Data are expressed as mean ± s.e.m., and a two-tailed Student’s t-test was used to calculate P values. n=3 (PDGFRB, GREM1), n=4 (DCN, LUM, PRRX1). Numbers above the line show significant P values.

