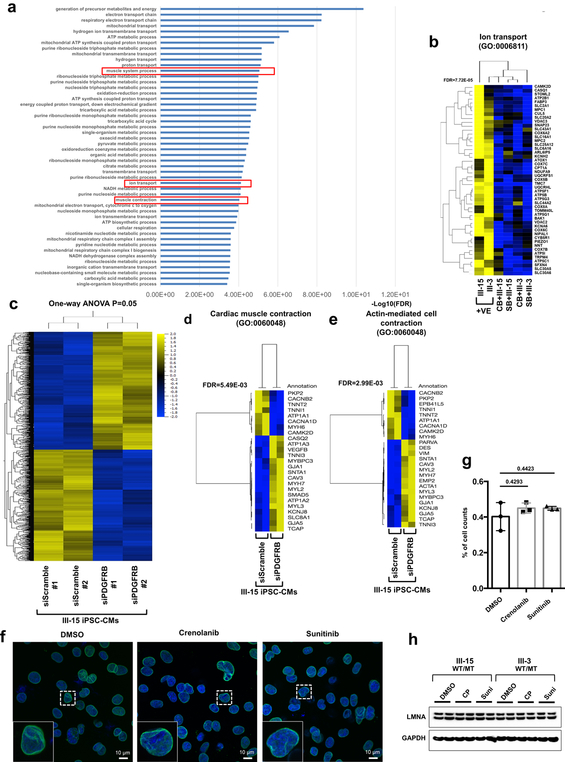
Extended Data Fig. 11. Gene expression profile of PDGFRB inhibition in LMNA-mutant iPSC-CMs.
a, GO analysis of down-regulated genes (n=352) in LMNA-mutant iPSC-CMs treated with PDGFRB inhibitor, crenolanib (100 nM) and sunitinib (500 nM), for 24 hr. b, Heat-map of expression profile of gene set related with GO function of Ion transport. The FDR values were obtained from GO enrichment analysis tool. c, Hierarchical clustering of AmpliSeq RNA-sequencing data under one-way ANOVA (p = 0.05) (n=230). Two different siRNAs for PDGFRB and scramble in LMNA-mutant iPSC-CMs (III-15; WT/MT). d, e, Heat-map of expression profile of gene (n=25) sets related with GO function of cardiac muscle contraction and actin-mediated cell contraction. The FDR values were obtained from GO enrichment analysis tool. f, No significant changes in abnormal nuclear structure of mutant iPSC-CMs by inhibition of PDGFRB were found. Representative images of mutant iPSC-CMs treated with PDGFRB inhibitor, crenolanib (100 nM) and sunitinib (500 nM), for 24 hr. iPSC-CMs were stained with specific antibodies for LMNB1 (Green). Blue signal represents DAPI. Scale bar, 10 μM. The experiments were repeated three times independently with similar results. g, Quantification of cells showing abnormal nuclear structure in mutant iPSC-CMs treated with PDGFRB inhibitor. The images were recorded from three differentiation batches. n=90 (DMSO), n=69 (Crenolanib), n=79 (Sunitinib). Data are expressed as mean ± s.e.m., and statistical significance was obtained using one-way ANOVA. Numbers above the line show P values. h, Immunoblot analysis of LMNA and GAPDH protein levels in mutant iPSC-CMs treated with PDGFRB inhibitor. The experiments were repeated twice independently with similar results.

