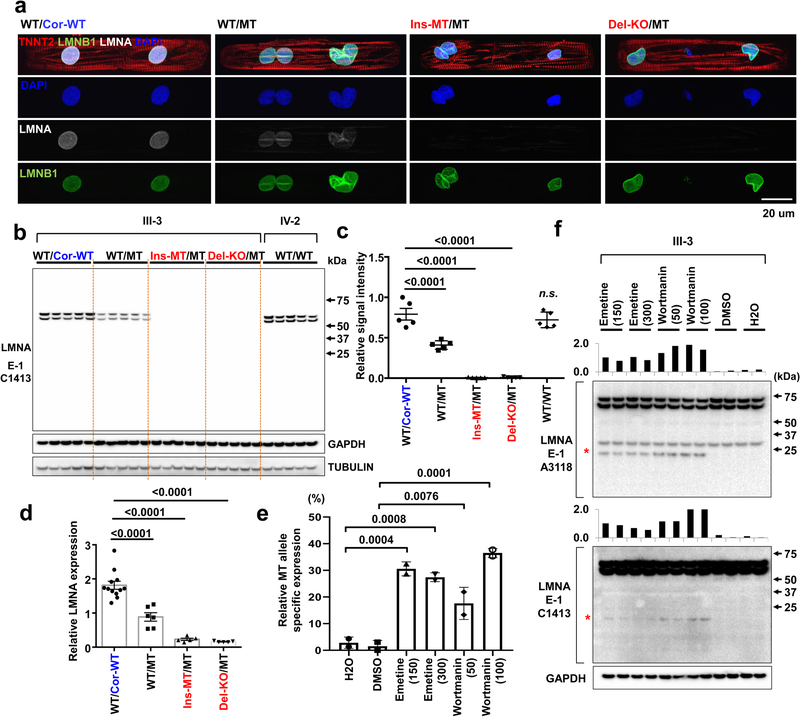
Figure 3. NMD pathway-mediated suppression of LMNA-mutant mRNA leads to haploinsufficiency of LMNA in mutant CMs.
a, Representative confocal images of control and mutant lines. Micro-patterned CMs were stained with specific antibodies for TNNT2 (Red), LMNA (White), and LMNB1 (Green). Blue color represents DAPI. Scale bar, 20 uM. The IF data were repeated 3 times independently with similar results. b, Immunoblot analysis of LMNA protein level in control and mutant iPSC-CMs. c, Quantification of signal intensity of LMNA band in (b). n=4. d, Relative mRNA expression of total LMNA in control and mutant iPSC-CMs. n=12 (WT/Cor-WT), n=6 (WT/MT), n=5 (Ins-MT/MT and Del-KO/MT). e, Digital PCR analysis of allele specific expression of LMNA in mutant iPSC-CMs treated with emetine (150 or 300 mcg/mL for 6 hr) and wortmannin (50 or 100 mM for 6 hr). n=2. Data are expressed as mean ± s.d., and statistical significance was obtained using one-way ANOVA. f, Immunoblot analysis of cell lysates from mutant iPSC-CMs treated with emetine and wortmannin. Two different batches of antibodies were used. Red asterisk represents truncated LMNA protein (about 14 kD size). Bar graph represents of signal intensity of truncated LMNA protein. The IB data in b and f were repeated twice independently with similar results. c-e, Data are expressed as mean ± s.e.m., and statistical significance was obtained using one-way ANOVA.

