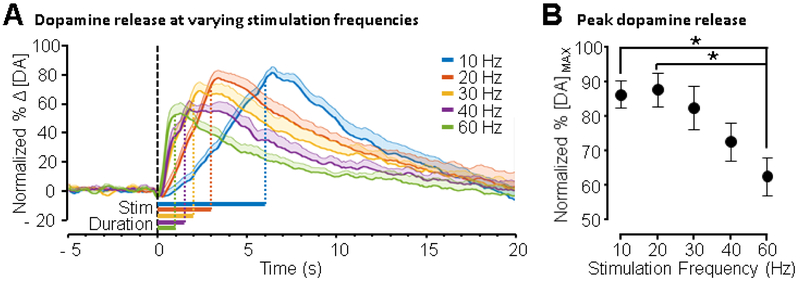
Figure 3. Effect of mPFC stimulation frequency on NAc dopamine release.
Frequency of mPFC stimulation was varied and total charge passed was held constant (± 600 μA, 60 pulses, 1 ms/phase pulse width, n = 10 rats). (A) Dopamine release was measured while administering 10, 20, 30, 40, and 60 Hz stimulation (data were smoothed using a 500 ms moving average). Data were normalized to maximum peak release recorded for each animal across all parameters. Normalized change in dopamine (Δ [DA]) versus time is shown and shaded regions indicate + SEM. The black dashed line indicates the start of stimulation and the horizontal colored bars under the traces show the stimulation duration. (B) Average normalized peak release is shown as a function of frequency. Dopamine release evoked by 20 Hz and 10 Hz was greater than dopamine release evoked by 60 Hz (p < 0.02 and p < 0.03 respectively, one-way ANOVA, Tukey multiple-comparisons test, error bars represent SEM).

