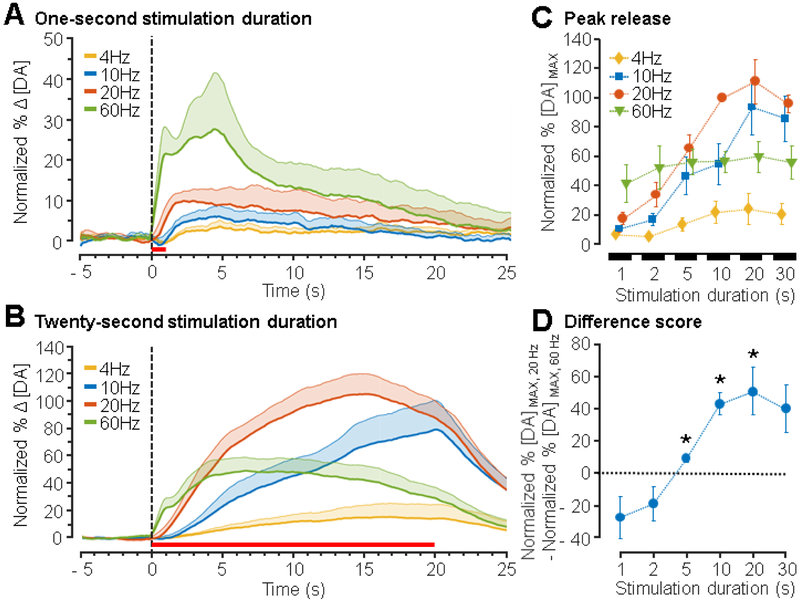
Figure 4. Dependence of peak dopamine release on the frequency of stimulation.
The mPFC was stimulated at 4, 10, 20, and 60 Hz for 1, 2, 5, 10, 20, and 30 s and dopamine release was recorded from the NAc (± 600 μA, 1 ms/phase pulse width, n = 6 – 8 rats). Peak dopamine release for each animal and for each parameter tested was normalized to peak dopamine release from a 20 Hz, 10 s stimulation within animal. (A) Mean normalized traces of dopamine release from 1 s stimulations. The stimulation period is indicated by the horizontal red line and shaded regions represent + SEM. (B) Mean trace of dopamine release from 20 s stimulations. The stimulation period is indicated by the horizontal red line below the traces. (C) Average normalized peak release as a function of duration for each stimulation frequency. A two-way ANOVA revealed effects of frequency (F 3,144 = 28.05, p < 0.0001), duration (F 5,144 = 16.69, p < 0.0001), and their interaction (F 15,144 = 3.07, p < 0.0003). All post-hoc comparisons are presented in Table S1. (D) Difference scores were then calculated by subtracting normalized dopamine release at 60 Hz stimulation from normalized dopamine release at 20 Hz stimulation for each duration. Stimulation at 20 Hz results in greater dopamine release than 60 Hz stimulation for durations from 5 to 20 s. Values significantly different from 0 are denoted with an asterisk wherein 0 indicates no difference between dopamine release from 20 Hz versus 60 Hz stimulation (multiple Student’s t-tests with Bonferroni-Holm correction, p < 0.05).

