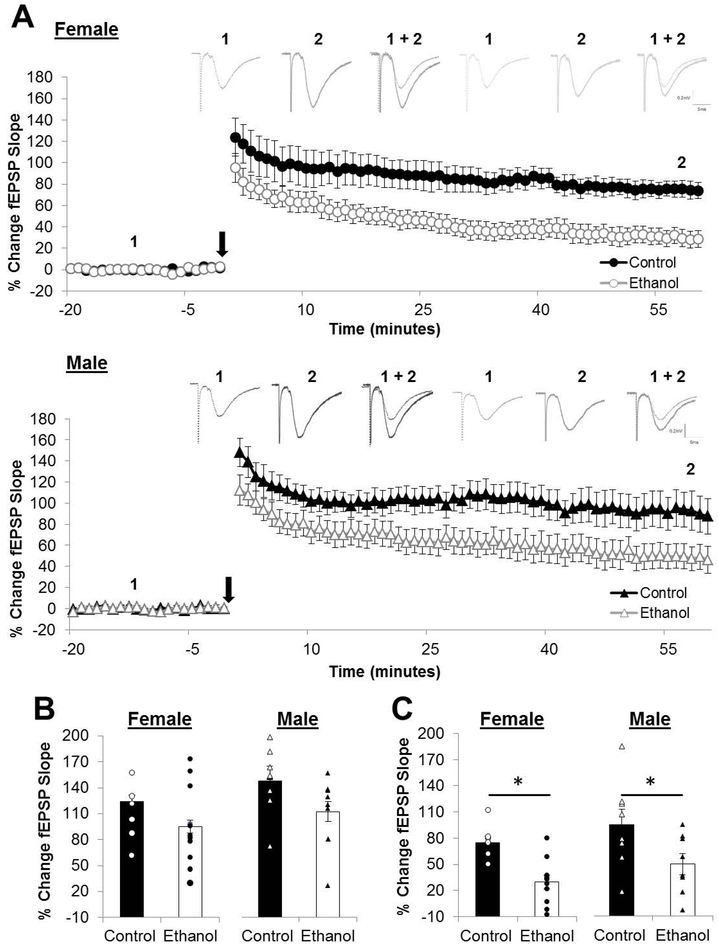
Figure 3. The magnitude of long-term potentiation is reduced in both sexes by prenatal ethanol exposure.
(A) Average long-term potentiation (LTP) recordings from the beginning of baseline to the end of the post-conditioning recording. Dots represent the average percentage of change in the field excitatory postsynaptic potential (fEPSP) slope relative to baseline and the error bars represent the SEM. Representative traces for each group are indicated above with 1 indicating the average fEPSP at baseline and 2 indicating the average fEPSP at the end of the post-conditioning recording. (B) Short-term post-tetanic potentiation (PTP) is measured as the percentage of change in the fEPSP slope for the first minute immediately following the HFS and is unaffected by PNEE. (C) LTP was measured as the average percentage of change in the fEPSP slope relative to baseline for minutes 55-60 following delivery of the high-frequency stimulation (HFS; indicated as black arrow in A). Following PNEE the magnitude of LTP was reduced in both sexes by approximately 50%. Bars represent the average percentage of change in the fEPSP slope for PTP (B) and LTP (C) with points representing the average PTP and LTP for each individual slice in this dataset. Experimental n: LTPControl Female: 74.82 ± 7.53 %; n = 7 slices, 5 animals, 2 litters; LTPPNEE Female: 29.67 ± 7.66 %; n = 11 slices, 5 animals, 3 litters; LTPControl Male: 91.81 ± 17.18 %; n = 8 slices, 5 animals, 3 litters; LTPPNEEMale: 34.89 ± 7.98 %; n = 8 slices, 5 animals, 3 litters. * p < 0.05.

